tech explorers, welcome!

Author: TRW (Page 4 of 4)

Move your Raspberry Pi into a new SD card.

There are plenty of lenghty explanations around the web on how to clone a Linux OS onto a new device, but I came through this great tool on my Pi which reduces it to a few minutes and no typing at all.

It is a built-in “SD Card Copier” which you can use to regularly backup your OS, or upgrade your file system to a larger SD card, which is my case.

1. Setup.

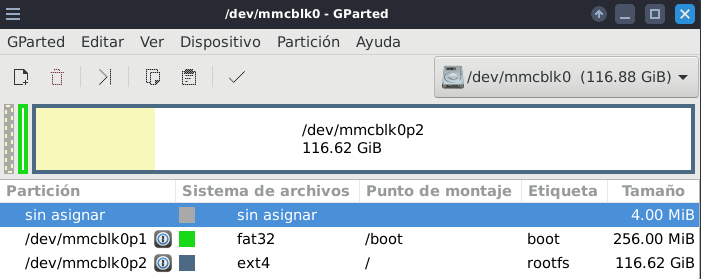
As mentioned, I want to move my Raspbian OS to a larger and faster SD card. Both cards need to be accessible on your Pi, so I got it set up like this:

  • Raspberry Pi 4B with Raspbian 10 Buster
  • 32Gb SD card on Pi's SD card slot.
  • 128Gb fast SD card on USB adapter via Pi's USB
  • For a backup, you can plug in a USB stick and transfer the backup onto it.

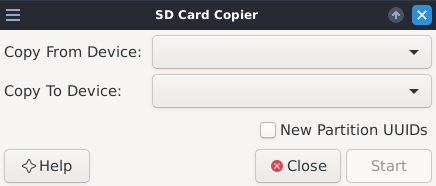
We will be using the "SD Card Copier" or "piclone", which should be built-in but you can install it on Raspbian via:

sudo apt-get update

sudo apt-get install piclone

[Not tested!] Piclone should work for other Linux distributions, if you're skillful enough to build all the required dependencies. In that case, you can access the github repository and follow the instructions there:

https://github.com/raspberrypi-ui/piclone

2. Transfer your OS via piclone.

Open the "SD Card Copier" either by finding the app launcher or via terminal, and make sure you have superuser permissions:

sudo piclone

The software is very simple and just looks like this:

Select each device from the drop down lists, and click "Start".

After a little while you will have a bootable copy of your current OS.

Help documentation mentions a 10-15minutes wait, but it took quite longer as it depends on your storage size.

3. Launch your new card.

Finally:

  • shut down your Pi
  • swap cards, and
  • check it is all up and running
  • with the upgraded storage
Using GParted to check the new partition details

Stellarium: the sky you’ll have tonight with the open planetarium

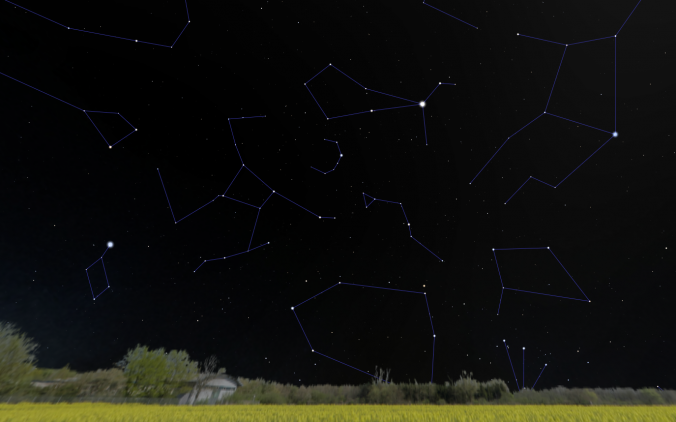
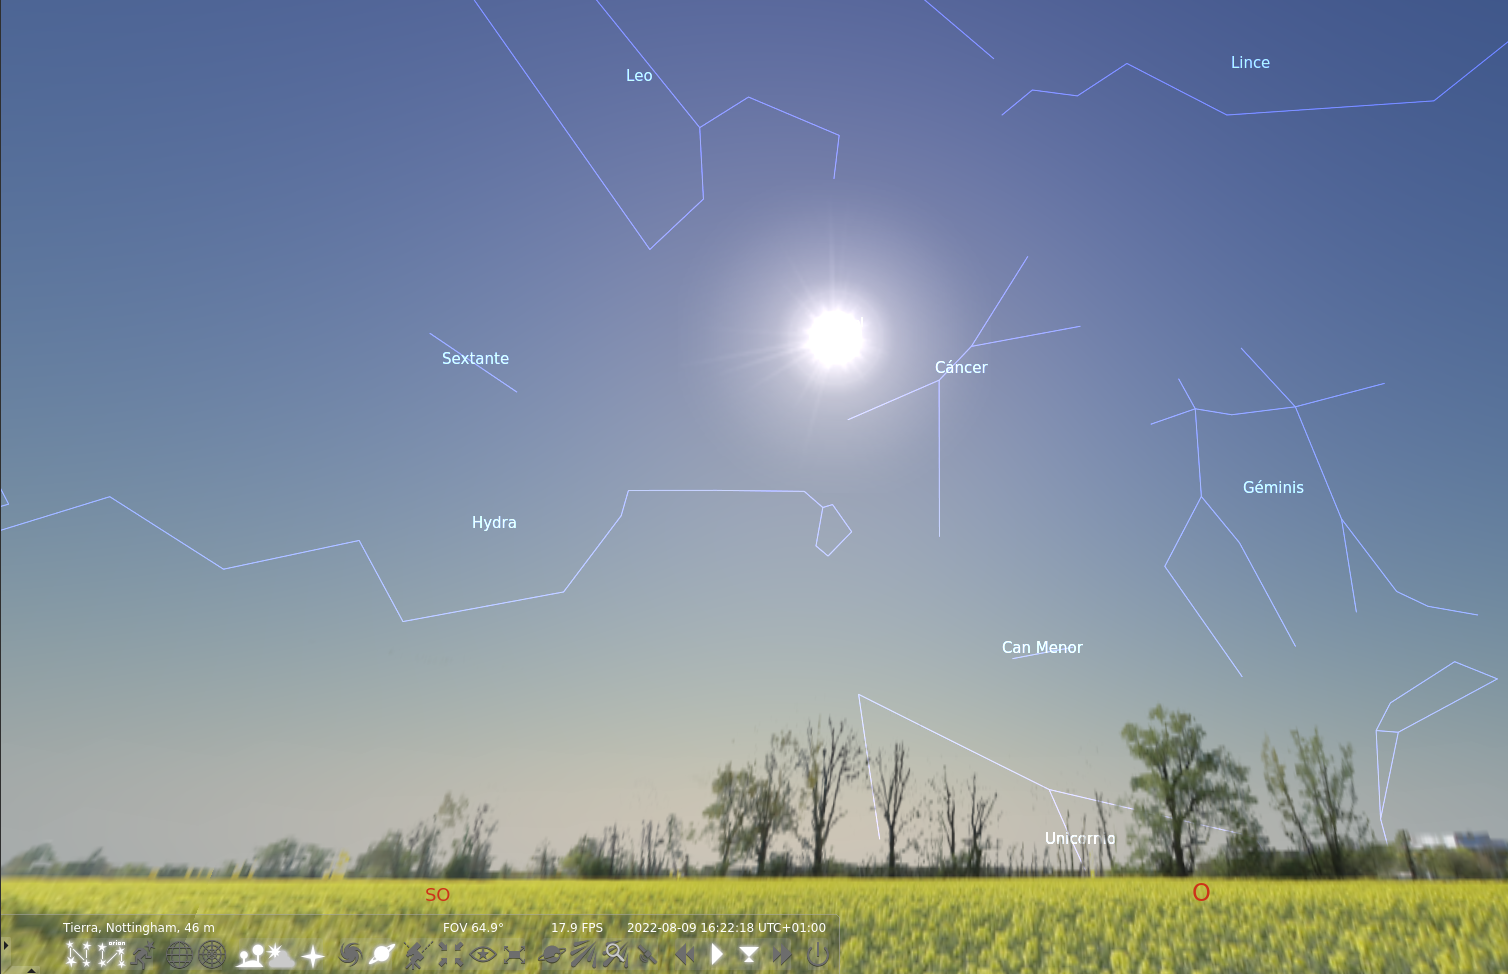
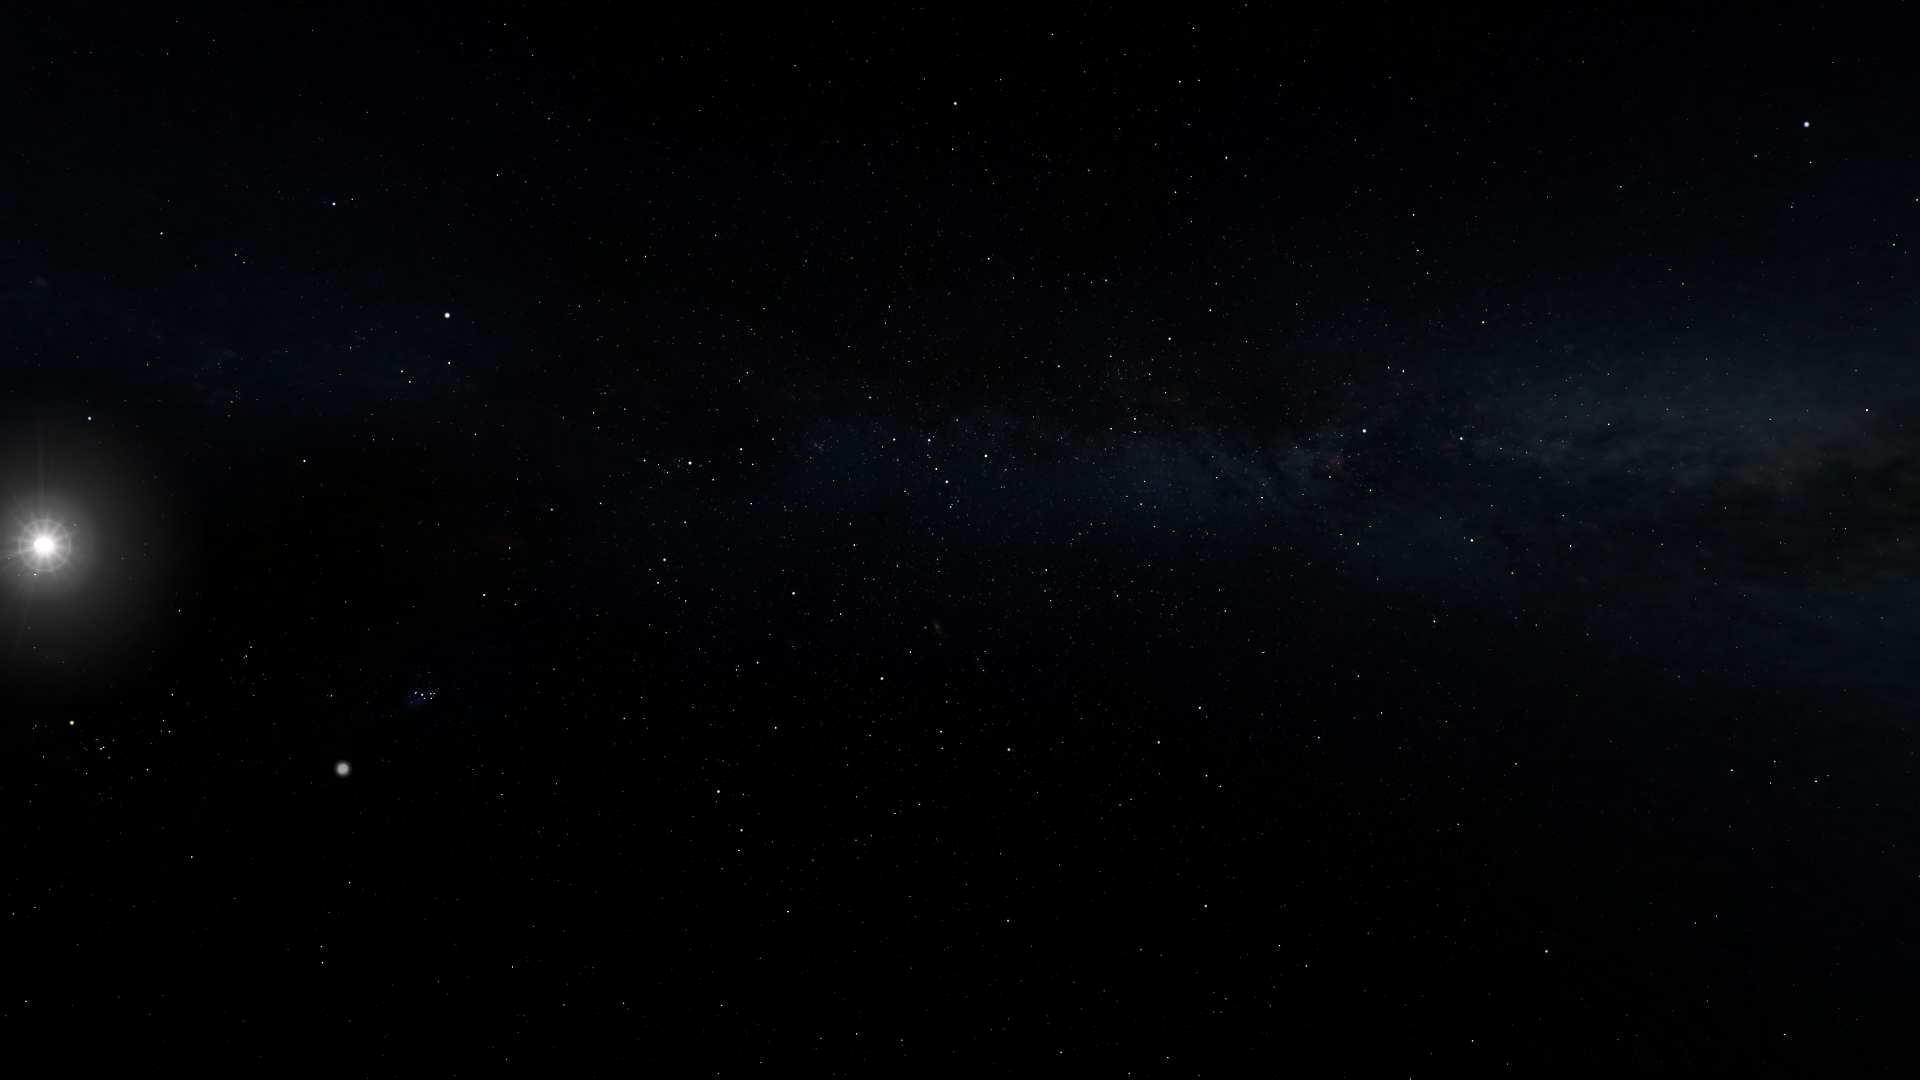
Did you wonder where did I get the header picture?

It’s not from the internet, not from any telescope. It’s from the great software Stellarium, an open-source planetarium with astronomical precision and unbeatable realism.

Requirements

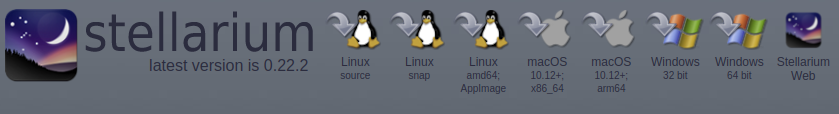
Stellarium is available for Windows, Mac and Linux, with a web version seamingly amazing, but lacking the configuration and plugins options that are offered by the desktop versions.

As they indicate in their website, the minimum requirements are:

  • Linux/Unix; Windows 7 and above; Mac OS X 10.12.0 and above
  • 3D graphics card which supports OpenGL 3.0 and GLSL 1.3 or OpenGL ES 2.0
  • 512 MiB RAM
  • 600 MiB on disk
  • Keyboard
  • Mouse, Touchpad or similar pointing device

And recommended:

  • 64-bit operating system
  • Linux/Unix; Windows 7 and above; Mac OS X 10.12.0 and above
  • 3D graphics card which supports OpenGL 3.3 and above
  • 1 GiB RAM or more
  • 1.5 GiB on disk
  • Keyboard
  • Mouse, Touchpad or similar pointing device
  • Moderately dark environment (deep shadow or indoors)

Basically it works in almost any device. Just download it from one of the options in the top menu.

Initial configuration

At startup, the position of all objects is synchronized with the PC time and it will be updated in real-time.

Using the bottom menu (or its [shortcuts] ) we can activate/disable different view elements. I recommend that you play with all of them and set it as you like:

  • Constellation lines [C].
  • Constellation labels [V].
  • Constellation art [R].
  • Equatorial grid [E].
  • Azimuthal grid [Z].
  • Ground [G].
  • Atmosphere [A].
  • Cardinal points [Q].
  • Deep-sky objects [D].
  • Planet labels [Alt+P].
  • Switch between equatorial or azimuthal mount [Ctrl+M].
  • Center on selected object [Space].
  • Night mode [Ctrl+N].
  • Full-screen mode [F11].
  • Show exoplanets [Ctrl+Alt+E].
  • Toggle meteor showers [Ctrl+Shift+M].
  • Show meteor showers search dialog [Ctrl+Alt+M].
  • Satellite hints [Ctrl+Z].
  • Decrease time speed [J].
  • Set normal time rate [N].
  • Set time to now [8].
  • Increase time speed [L].
  • Quit [Ctrl+Q].

On the lateral menu we have the following options:

  • Location window [F6]. Here we can specify the location of our view, being a place on Earth or any other planet in the list.
  • Date/time window [F5]. We can choose any date from past or future as the orbits are perfectly known for centuries.
  • Sky and viewing options window [F4]. It lets us calibrate the visibility of objects, the projection or the landscape picture, between others.
  • Search window [F3]. It will locate an object from space by its name.
  • Configuration window [F2]. Shows settings like language, system time, the use of extras or scripts, etc.
  • Astronomical calculations window [F10]. Shows the details of calculations done by the software, like object positions, or events that occur today.
  • Help window [F1].

Uses

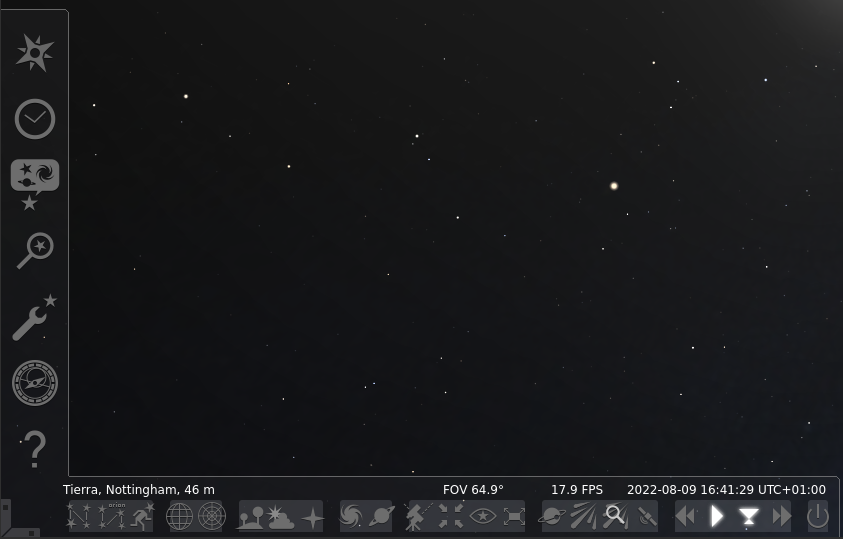
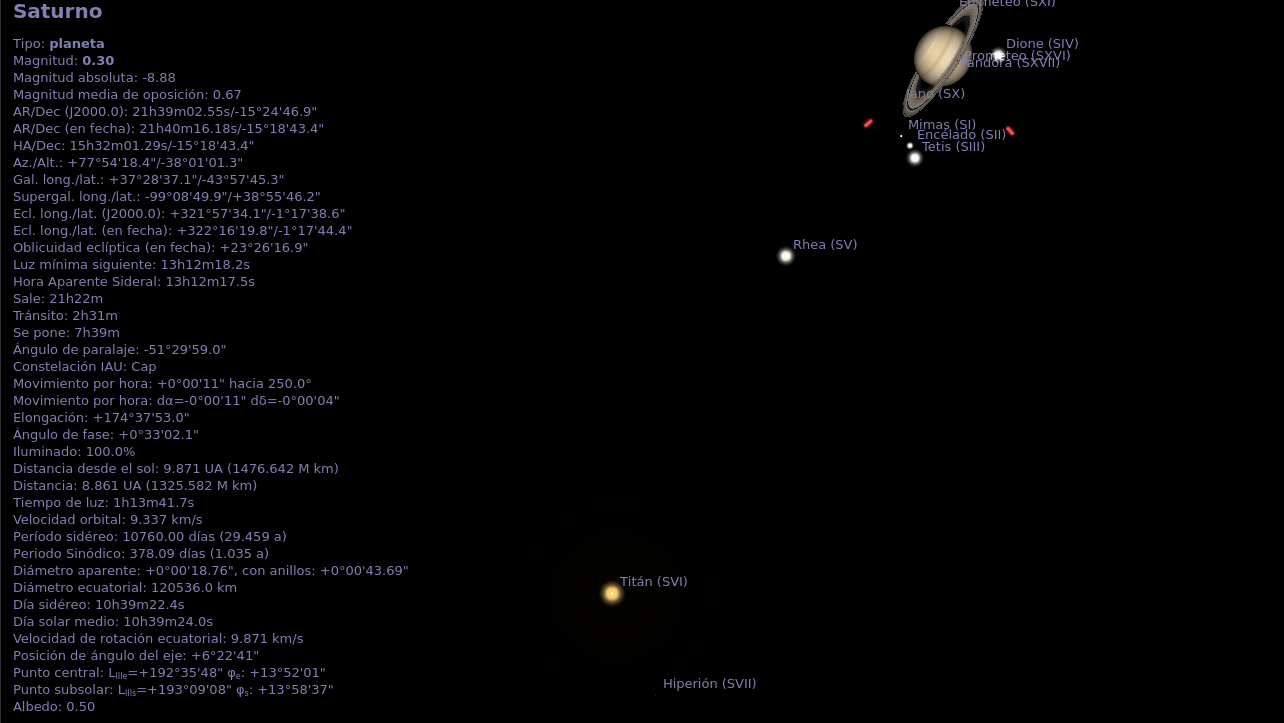
We can simply disable the atmosphere [A] and investigate the objects in space left-clicking on them, which will show information about the selected object. If we press [Space] the view will follow the object.

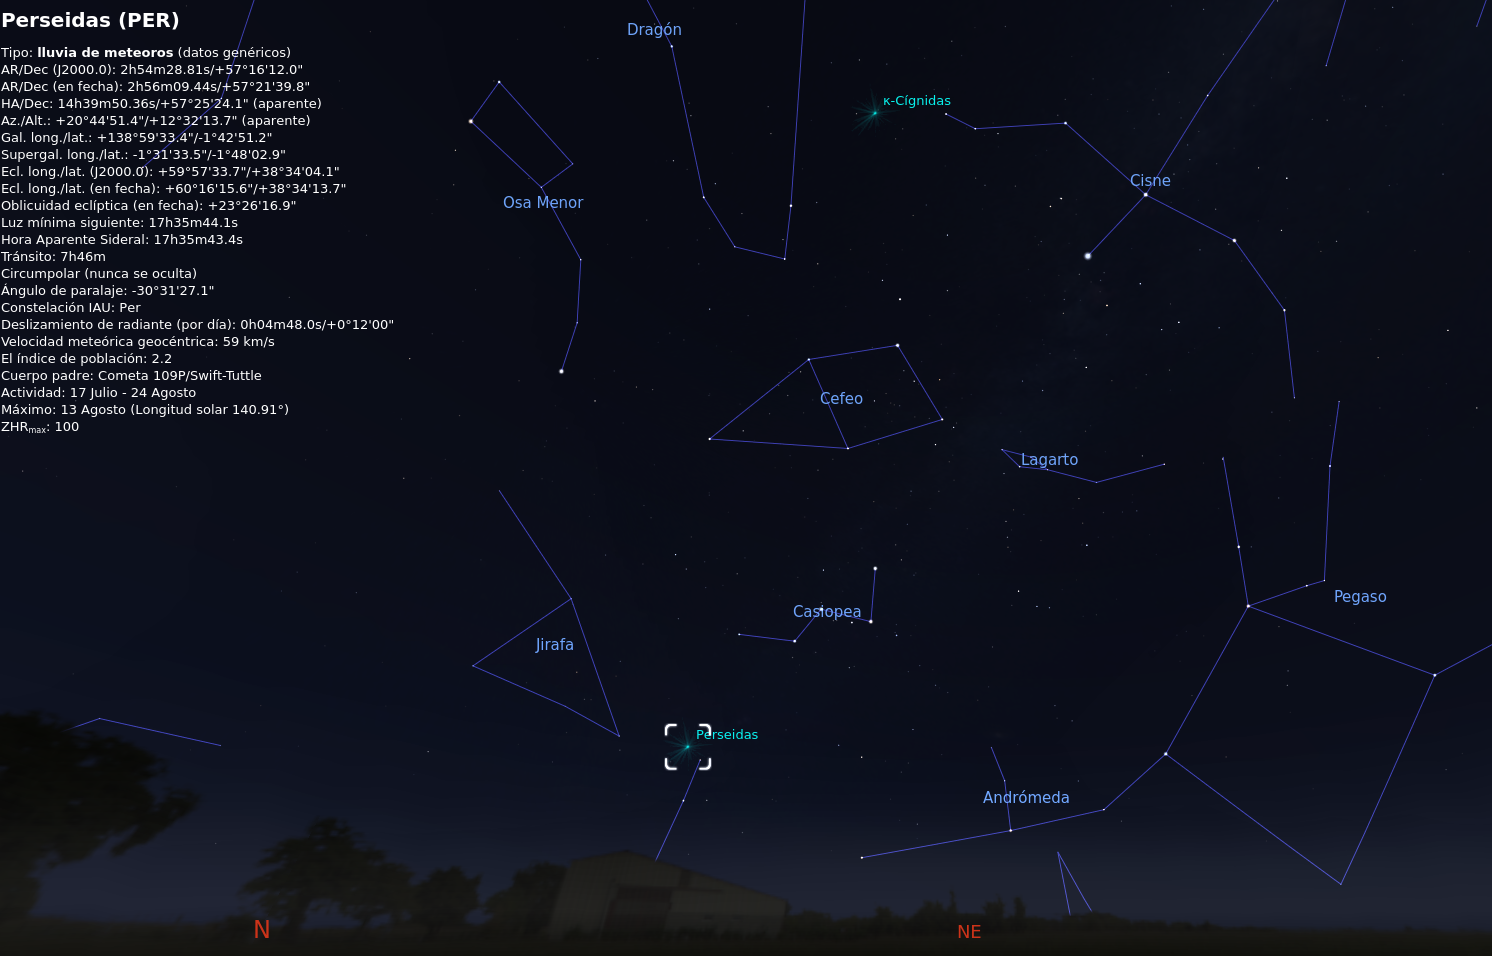
We can also activate constellation lines [C] and labels [V], show meteor showers [Ctrl+Shift+M] and advance time until the sun sets [F5] or [L]. This way we can find out if there will be a starry night (or any other night) and know its location.

Now in August we are reaching the Perseidas maximum activity, that will occur on 13th August according to the calculations for the Iberian peninsula, and will be located moving from North to Northeast.

Or simply play with the many possibilities of the software and get an incredible background picture like the one used on the header of this blog.

Do you imagine any other possibilities for the software? Any configuration tip or any worth script? Leave your comment on Twitter 🐦 See you soon!

🐦 @RoamingWorkshop

Get average sea temperature (or any other raster map data)

UPDATE 2023! Hourly WMS service removed and daily version updated to V2. WMS version updated to 1.3.0

Recently it’s been trendy to talk about the increased warming of the Sea, and I’ve found very few maps where you can actually click and check the temperature it pretends to indicate.

So I’ve done my own:

  1. I’m going to find a WMS with the required raster information,
  2. Replicate the legend using html <canvas> elements,
  3. And obtain the temperature value matching the pixel color value.

The data

There are several and confusing information sources:

  • Puertos del Estado:
    My first attempt was to check the Spanish State Ports website, but the only good thing I found was that they use Leaflet.. They have a decent real-time viewer, but it's really complicated to access the data to do something with them (although I'll show you how in the future).
  • Copernicus:
    "Copernicus is the European Union's Earth observation programme", as they indicate in their website, and they gather the majority of geographical and environmental information produced in the EU member countries.
    In their marine section we'll find Sea Surface Temperature (SST) data obtained from satellite imagery and other instruments from different euopean organisms.

Global Ocean OSTIA Diurnal Skin Sea Surface Temperature

After trying them all, the most complete is the global map produced by the MetOffice.

As they indicate, it shows the hourly average in a gap-free map that uses in-situ, satellite and infrared radiometry.

The basemap

I'll create a basemap as I've shown in other posts.

As I'm adding a raster WMS, consisting of low resolution pixels, I'll add a layer with world countries from Eurostat.

I'll download it in geoJSON format and convert it into a variable called "countries" in a new file CNTR_RG_01M_2020_4326.js . I need to insert the following heading so it's read correctly (cole the JSON variable with "]}" so it's read correctly).

var countries = {
"type": "FeatureCollection",
"crs": { "type": "name", "properties": { "name": "urn:ogc:def:crs:OGC:1.3:CRS84" } },
"features": [
{"type": "FeatureCollection", "features": [{"type": "Feature", "geometry": {"type": "MultiPolygon", "coordinates": [[[[51.590556, 24.242975],   ......   ]}

Once created the file, we can link it in our .html <head>:

<script src="./CNTR_RG_01M_2020_4326.js"></script>

TIP! If you have issues creating this file, you can download it from this server or add the full link to the head script

This basemap is looking like this:

SST raster data
<!DOCTYPE html>
<html>
<head>

<title>SST raster data</title>

<link rel="icon" href="data:image/svg+xml,<svg xmlns=%22http://www.w3.org/2000/svg%22 viewBox=%220 0 100 100%22><text y=%22.9em%22 font-size=%2290%22>🌡</text></svg>">

<link rel="stylesheet" href="https://unpkg.com/[email protected]/dist/leaflet.css"
   integrity="sha512-hoalWLoI8r4UszCkZ5kL8vayOGVae1oxXe/2A4AO6J9+580uKHDO3JdHb7NzwwzK5xr/Fs0W40kiNHxM9vyTtQ=="
   crossorigin=""/>
   
<script src="https://unpkg.com/[email protected]/dist/leaflet.js"
   integrity="sha512-BB3hKbKWOc9Ez/TAwyWxNXeoV9c1v6FIeYiBieIWkpLjauysF18NzgR1MBNBXf8/KABdlkX68nAhlwcDFLGPCQ=="
   crossorigin=""></script>

<script src="./CNTR_RG_01M_2020_4326.js"></script>

</head>

<style>
body{
	margin:0;
}
#base1{
	width:100vw;
	height:100vh;
}
</style>

<body>
	<div id="base1"></div>
</body>
<script>

	//Crear mapa de Leaflet
	var map = L.map('base1').setView([48, 10], 5);
	
	//Añadimos capa de paises
	L.geoJSON(countries, {	//usa la variable "countries" que está definida en el archivo 'CNTR_RG_01M_2020_4326.js'
		style: function(){	//sobreescribimos el estilo por defecto de Leaflet con algo más estético
			return {
			fillColor: "BurlyWood",
			color: "bisque",
			fillOpacity: 1,
			};
		}
	}).addTo(map);

</script>

</html>

Query and add the WMS

I'll add the global daily map by MetOffice given by the Copernicus project.

To query the details of the WMS, we must find the medatada file, which in this case is in the "DATA-ACCESS" tab.

In this file we make a search for "WMS" to find the link to the service.

And it's the following:

https://nrt.cmems-du.eu/thredds/wms/METOFFICE-GLO-SST-L4-NRT-OBS-SST-V2

We'll add the GeoServer functions "?service=WMS&request=GetCapabilities" which will show the available information in the WMS like layers, legends, styles or dimensions.

https://nrt.cmems-du.eu/thredds/wms/METOFFICE-GLO-SST-L4-NRT-OBS-SST-V2?service=WMS&request=GetCapabilities

Let's add the WMS layer as stated in Leaflet docs:

	var base = L.tileLayer.wms(URL, {
		layers: 'analysed_sst', //cambiar la capa. Comprobar con ?service=WMS&request=GetCapabilities
		format: 'image/png',
		transparent: true,
        styles: 'boxfill/rainbow',
        //time: '2022-08-02T16:30:00.000Z',
		attribution: "© <a target='_blank' href='https://resources.marine.copernicus.eu/product-detail/SST_GLO_SST_L4_NRT_OBSERVATIONS_010_001/INFORMATION'>Copernicus Marine Service & MetOffice ◳</a>"
	}).addTo(map);

Find the options values that you need in the metadata file. Specifically these tags:

  • <Layer queryable="1"><Name> will show the layer names that we can introduce in the proeprty "layers:"
  • <Style><Name> will show the name for the different styles available to represent the raster map and we'll introduce it in the property "styles:".
  • <LegenURL> shows a link to the legend used for that style.
  • <Dimension> will show the units that we can use when querying the WMS. In this case it's a time unit as we can vary the date that the map represents. I'll comment it for the moment so it will show the last available date.
SST raster data

Finally, let's add the legend to the map to have a visual reference.

It's inserted as an image in the <body> and some CSS in <style>:

<style>
body{
	margin:0;
}
#base{
	width:100%;
	height:350px;
}
.leyenda{
	position:absolute;
	width:110px;
	height:264px;
	top:5px;
	right:5px;
	z-Index:1001;
	display:flex;
	justify-content:flex-end;
}
</style>

<body>
    <div class="leyenda">
		<img src="https://nrt.cmems-du.eu/thredds/wms/METOFFICE-GLO-SST-L4-NRT-OBS-SST-V2?REQUEST=GetLegendGraphic&LAYER=analysed_sst&PALETTE=rainbow&transparent=true"></img>
	</div>

	<div id="base"></div>
</body>
SST raster data

As you can see, it's hard to try and figure out a value for any of the pixels in the map.

Mimic the legend to query the data

To know the temperature that a pixel represents, we should know the position of such pixel color in the legend, and its proportional value compared to the extreme values (310kPa= 36.85ºC y 210kPa=-3.15ºC).

The problem is that CORS policy won't let you query the image as it's outside our domain. On the other hand, if we add the image to our domain, it will have a low resolution and lose precision in the colors that it shows.

That's why I'll mimic the legend using a <canvas> element.

    <div class="leyenda">
		<canvas id="gradientC"></canvas>
		<img src="https://nrt.cmems-du.eu/thredds/wms/METOFFICE-GLO-SST-L4-NRT-OBS-SST-V2?REQUEST=GetLegendGraphic&LAYER=analysed_sst&PALETTE=rainbow&transparent=true"></img>
	</div>

Using javascript, and the HTML Color Picker, we'll define the different color stops in a "gradient" type fill that will replace the original legend.

	function grad(){
		//Generamos la leyenda en el canvas 'gradientC'
		var ctx=document.getElementById("gradientC").getContext('2d');
		//Definimos un gradiente lineal
		var grd=ctx.createLinearGradient(0,150,0,0);
		//Calibrar las paradas del gradiente tomando muestras de la imagen
		//Descomentar la imagen que va junto al canvas en el html
		//Usar HTML color picker: https://www.w3schools.com/colors/colors_picker.asp
		grd.addColorStop(0, "rgb(0, 0, 146)");			//0 -> -3.15
		grd.addColorStop(0.09, "rgb(0, 0, 247)");		//1
		grd.addColorStop(0.185, "rgb(1, 61, 255)");		//2
		grd.addColorStop(0.26, "rgb(0, 146, 254)");		//3
		grd.addColorStop(0.3075, "rgb(0, 183, 255)");		//4
		grd.addColorStop(0.375, "rgb(3, 251, 252)");	//5
		grd.addColorStop(0.5, "rgb(111, 255, 144)");	//6 -> 20.0
		grd.addColorStop(0.575, "rgb(191, 255, 62)");	//7
		grd.addColorStop(0.64, "rgb(255, 255, 30)");	//8
		grd.addColorStop(0.74, "rgb(255, 162, 1)");		//9
		grd.addColorStop(0.805, "rgb(255, 83, 0)");		//10
		grd.addColorStop(0.90, "rgb(252, 4, 1)");		//11
		grd.addColorStop(1, "rgb(144, 0, 0)");			//12 -> 36.85
		
		//añadir el gradiente al canvas
		ctx.fillStyle = grd;
		ctx.fillRect(0,0,255,255);
	}
	
	//ejecutamos la funcion del gradiente al inicio
	grad();
SST raster data

Pixel selector creation and temperature calculator

Once we have our own legend, we create another element that shows the selected pixel as well as the temperature obtained.

To use the pixel color, we'll add another <canvas>:

	<canvas id="temp">
		<img id="pixel" src="" ALT="CLICK PARA OBTENER TEMPERATURA"></img>
	</canvas>
	
	<div id="tempTxt">PINCHA SOBRE EL MAR PARA CONOCER SU TEMPERATURA</div>

And format the new elements in <style>:

#temp{
	position:absolute;
	bottom:10px;
	left:10px;
	width:150px;
	height:150px;
	background-color: lightgrey;
	border: 2px solid white;
	border-radius: 5px;
	z-Index: 1001;
}
#tempTxt{
	display:flex;
	position:absolute;
	bottom:10px;
	left:10px;
	width:150px;
	height:150px;
	padding: 2px 2px 2px 2px;
	z-Index:1001;
	font-family:verdana;
	font-size:16px;
	font-weight:bold;
	text-align:center;
	align-items:center;
    word-wrap:break-word;
    word-break:break-word;
}
SST raster data
CLICK PARA OBTENER TEMPERATURA
PINCHA SOBRE EL MAR PARA CONOCER SU TEMPERATURA

Now we add two functions:

  • onMapClick() to obtain the selected pixel and pass it to the lower box. We use a GET request of the WMS service using the coordinates of the pixel location. It's important to take into account the reference system which is not the usual (EPSG:3857) for unit conversions.
	//Añadimos función al hacer click en el mapa
	map.addEventListener('click', onMapClick);
	
	function onMapClick(e) {
		//ejecutamos la función grad con cada click
		grad();
		//Obtenemos las coordenadas del pinto seleccionado
        var latlngStr = '(' + e.latlng.lat.toFixed(3) + ', ' + e.latlng.lng.toFixed(3) + ')';
		//console.log(latlngStr);

		//Definir el CRS para enviar la consulta al WMS
		const proj = L.CRS.EPSG3857;
        //const proj = L.CRS.EPSG4326;
		
		//Definimos los límites del mapa que pediremos al WMS para que sea aproximadamente de 1 pixel
		var BBOX=((proj.project(e.latlng).x)-10)+","+((proj.project(e.latlng).y)-10)+","+((proj.project(e.latlng).x)+10)+","+((proj.project(e.latlng).y)+10);
		
		//console.log(BBOX);
		
		//Restablecemos la imagen en cada click
		var tTxt=document.getElementById("tempTxt");
		var pix= document.getElementById("pixel");
		var ctx=document.getElementById("temp").getContext("2d");
		//pix.src="";
		ctx.fillStyle="lightgrey";
		ctx.fillRect(0,0,300,300);
		
		//Realizamos la petición del pixel seleccionado
		var xPix= new XMLHttpRequest();
		xPix.onreadystatechange = function(){
			if (this.readyState == 4 && this.status == 200) {
				pix.src=URL+WMS+BBOX;
				pix.onload=function(){
					ctx.drawImage(pix,0,0,300,300);
					tTxt.innerHTML="INTERPRETANDO LEYENDA...";
					//Interpretamos el pixel según la leyenda
					leyenda();
				}
				pix.crossOrigin="anonymous";
			}
		};
		
		xPix.open("GET", URL+WMS+BBOX);
		xPix.send();
		
		tTxt.innerHTML="CARGANDO TEMPERATURA...";


    }
  • leyenda() calculates the temperature of the selected pixel according to our legend. It shows the value in the lower box and also adds a white indication mark in the legend.
    The calculation algorithm consists in running the legend pixel by pixel (vertically) and comparing the difference of the rgb(x,y,z) values of the legend with the rgb values in the selected pixel. We'll be keeping the minimum difference until we reach the last pixel, so there will be situations where the solution is not 100% exact. This is not the best way, but it's fast (to understand and execute) and quite effective.
	function leyenda(){
		var ctx=document.getElementById("temp").getContext("2d");
		var tTxt=document.getElementById("tempTxt");
		//obtenemos el valor RGB del pixel seleccionado
		var RGB=ctx.getImageData(5,5,1,-1).data;
		//console.log(ctx.getImageData(10,10,1,-1).data);
		
		var key=document.getElementById("gradientC").getContext("2d");
		var max=150;
		
		var min=1000;//la máxima diferencia sólo puede ser de 255x3=765
		var dif="";
		var val="";
		
		//recorremos el gradiente de la leyenda pixel a pixel para obtener el valor de temperatura
		for(var p=1;p<=max;p++){
			//obtenemos el valor actual
			var temp=key.getImageData(1,p,1,-1).data;
			//console.log(temp);
			//comparamos con el seleccionado y obtenemos la diferencia total
			dif=Math.abs(parseInt(temp[0])-parseInt(RGB[0]))+Math.abs(parseInt(temp[1])-parseInt(RGB[1]))+Math.abs(parseInt(temp[2])-parseInt(RGB[2]));
			if(dif<min){
				min=dif;
				val=p;
				//console.log("Obj:"+RGB[0]+","+RGB[1]+","+RGB[2]+"\nTemp:"+temp[0]+","+temp[1]+","+temp[2]+"\nDif:"+dif);
			}
		}
		var T=36.85-(val*40/max);
		T=T.toFixed(2);
		//pintamos una línea de referencia en la leyenda
		key.fillStyle="white";
		key.fillRect(0,val,255,1);
		
		//definimos la temperatura en el texto
		//si el color da gris, hemos pinchado en la tierra
		//console.log("T= "+T);
		if(RGB[0]==211&RGB[1]==211&RGB[2]==211){
			tTxt.innerHTML="PINCHA SOBRE EL MAR PARA CONOCER SU TEMPERATURA";
		}else if(typeof T == "undefined"){
			tTxt.innerHTML="¡ERROR!<BR>PRUEBA OTRO PUNTO DEL MAR.";
		}else{
			tTxt.innerHTML="TEMPERATURA APROXIMADA: <br><br>"+T+" ºC";
		}
		//console.log(key.getImageData(1,150,1,-1).data);
	}

We also ommit the original legend and add some custom text.

Finally, we add a date controller in the <body>:

    <div id="timeBlock">
        <button id="reini" onclick="reiniT()">↺</button>
	    <input type="datetime-local" id="timeInp" name="maptime">
    </div>

And it's CSS:

#tempTxt{
	display:flex;
	position:absolute;
	bottom:10px;
	left:10px;
	width:150px;
	height:150px;
	padding: 2px 2px 2px 2px;
	z-Index:1001;
	font-family:verdana;
	font-size:16px;
	font-weight:bold;
	text-align:center;
	align-items:center;
    word-wrap:break-word;
    word-break:break-word;
}
#timeBlock{
    display:flex;
    flex-direction:row;
	position:absolute;
    width:250px;
    top:10px;
    left:50%;
    margin-left:-125px;
    justify-content:center;
	z-Index:1002;
    font-family:verdana;
    font-size:14px;
}
#timeInp{
	width:200px;
    height:30px;
	text-align:center;
}
#reini{
    width:35px;
    height:35px;
    margin-right:5px;
    font-weight:bold;
    font-size:18px;
    padding:0;
}

As well as a few javascript lines to:

  • get the last available date and display it,
  • update the map when there's a change
  • and define maximum and minimum allowed values
	//Obtener última hora de actualizacion del mapa
	var timeInp=document.getElementById("timeInp");
	var t;
    var maxT;
    var minT;
	var xTime = new XMLHttpRequest();
		xTime.onreadystatechange = function(){
			if (this.readyState == 4 && this.status == 200) {
				//convertimos el XML según https://www.w3schools.com/xml/xml_parser.asp
                var xmlDoc=this.responseXML;
                t=xmlDoc.children[0].children[1].children[2].children[12].children[1].children[5].attributes[4].value;
                //Lo convertimos en un objeto fecha quitando los segundos
        		t=new Date(t);
                t=t.toISOString().substring(0,t.toISOString().length-8);
                //Lo pasamos al selector y lo establecemos como máximo
                timeInp.max=t;
                timeInp.value=t;
                maxT=new Date(t);

                //también establecemos el minimo
                t=xmlDoc.children[0].children[1].children[2].children[12].children[1].children[5].innerHTML.trim();
                t=t.substring(0,16);
                timeInp.min=t;
                minT=new Date(t);
			}
		};
		
		xTime.open("GET", URL+"?service=WMS&request=GetCapabilities");
		xTime.send();
	
	//Selector de fecha para WMS
		
	timeInp.addEventListener("change", function(){
		t=new Date(timeInp.value.toString());
		t.setHours(12-t.getTimezoneOffset()/60);
        t=t.toISOString().substring(0,t.toISOString().length-8);
	    timeInp.value=t;
	    t=new Date(timeInp.value);
            t.setHours(12-t.getTimezoneOffset()/60);

        //si estamos en el rango de datos..
        if(t>=minT && t<=maxT){
		    t=t.toISOString();
            //actualziamos el mapa
		    base.setParams({
			    time: t,
			    styles: "boxfill/rainbow",
		    },0);
        }else{//mostramos error
            alert("La fecha introducida está fuera de rango.");
        }
	});

    //funcion de reinicio de fecha
    function reiniT(){
        timeInp.value=maxT.toISOString().substring(0,maxT.toISOString().length-13)+"23:30";
    }

Result

Joining it all, you'll end up with something like this, which you can see fullscreen here:

If you liked this, have any doubts or any idea to improve this or other maps, drop your thought in Twitter 🐦

🐦 @RoamingWorkshop

I'll leave the full code next. See you next!

<!DOCTYPE html>
<html>
<head>
<meta charset='UTF-8'\>
<title>SST raster data</title>

<link rel="icon" href="data:image/svg+xml,<svg xmlns=%22http://www.w3.org/2000/svg%22 viewBox=%220 0 100 100%22><text y=%22.9em%22 font-size=%2290%22>🌡</text></svg>">

<link rel="stylesheet" href="https://unpkg.com/[email protected]/dist/leaflet.css"
   integrity="sha512-hoalWLoI8r4UszCkZ5kL8vayOGVae1oxXe/2A4AO6J9+580uKHDO3JdHb7NzwwzK5xr/Fs0W40kiNHxM9vyTtQ=="
   crossorigin=""/>
   
<script src="https://unpkg.com/[email protected]/dist/leaflet.js"
   integrity="sha512-BB3hKbKWOc9Ez/TAwyWxNXeoV9c1v6FIeYiBieIWkpLjauysF18NzgR1MBNBXf8/KABdlkX68nAhlwcDFLGPCQ=="
   crossorigin=""></script>

<script src="./CNTR_RG_01M_2020_4326.js"></script>

</head>

<style>
body{
	margin:0;
}
#temp{
	position:absolute;
	bottom:10px;
	left:10px;
	width:150px;
	height:150px;
	background-color: lightgrey;
	border: 2px solid white;
	border-radius: 5px;
	z-Index: 1001;
}
#map{
	width:100vw;
	height:100vh;
}
.leyenda{
	position:absolute;
	top:10px;
	z-Index:1001;
	display:flex;
	flex-direction:row;
	width:50px;
	height:255px;
	right: 50px;
	font-family:verdana;
	font-size:11px;
}
.leyenda-txt{
	display:flex;
	flex-direction:column;
	align-items: stretch;
	justify-content:center;
	text-align:right;
	font-weight:bold;
	text-shadow: 0 0 6px white;
	margin: 0px 3px 0px 3px;
}
.leyenda-val{
	height:255px;
	margin-top:-5px;
}
#gradientC{
	z-Index=1002;
	width:25px;
	height:255px;
	margin:0;
}
#tempTxt{
	display:flex;
	position:absolute;
	bottom:10px;
	left:10px;
	width:150px;
	height:150px;
	padding: 2px 2px 2px 2px;
	z-Index:1001;
	font-family:verdana;
	font-size:16px;
	font-weight:bold;
	text-align:center;
	align-items:center;
    word-wrap:break-word;
    word-break:break-word;
}
#timeBlock{
    display:flex;
    flex-direction:row;
	position:absolute;
    width:250px;
    top:10px;
    left:50%;
    margin-left:-125px;
    justify-content:center;
	z-Index:1002;
    font-family:verdana;
    font-size:14px;
}
#timeInp{
	width:200px;
    height:30px;
	text-align:center;
}
#reini{
    width:35px;
    height:35px;
    margin-right:5px;
    font-weight:bold;
    font-size:18px;
    padding:0;
}
</style>

<body>

    <div id="timeBlock">
        <button id="reini" onclick="reiniT()">↺</button>
	    <input type="datetime-local" id="timeInp" name="maptime">
    </div>

	<div class="leyenda">
		<div class="leyenda-txt">
			<div class="leyenda-val">36.85</div>
			<div class="leyenda-val">20.0</div>
			<div>-3.15</div>
			</div>
		<!--Descomentar para mostrar la imagen descargada de la leyenda y calibrar el gradiente-->
		<!--<img src="leyenda.jpg"></img>-->
		
		<canvas id="gradientC"></canvas>
			
		<div class="leyenda-txt" style="margin-top:-10px;"><div >(ºC)</div></div>
	</div>
	
	<canvas id="temp">
		<img id="pixel" src="" ALT="CLICK PARA OBTENER TEMPERATURA"></img>
	</canvas>
	
	<div id="tempTxt">PINCHA SOBRE EL MAR PARA CONOCER SU TEMPERATURA</div>
	
	<div id="map"></div>
</body>
<script>

	//Crear mapa de Leaflet
	var map = L.map('map').setView([48, 10], 5);
	
	//Añadimos capa de paises
	L.geoJSON(countries, {	//usa la variable "countries" que está definida en el archivo 'CNTR_RG_01M_2020_4326.js'
		style: function(){	//sobreescribimos el estilo por defecto de Leaflet con algo más estético
			return {
			fillColor: "BurlyWood",
			color: "bisque",
			fillOpacity: 1,
			};
		}
	}).addTo(map);
	
	//Añadimos servicio WMS siguiendo https://leafletjs.com/examples/wms/wms.html
	
	//OSTIA Global daily mean SST
	var URL="https://nrt.cmems-du.eu/thredds/wms/METOFFICE-GLO-SST-L4-NRT-OBS-SST-V2"
	var WMS = '?service=WMS&request=GetMap&version=1.3.0&layers=analysed_sst&styles=&format=image%2Fpng&transparent=true&width=200&height=200&CRS=EPSG:3857&bbox=';
	
	//OSTIA Global hourly mean diurnal skin SST
	//var URL="https://nrt.cmems-du.eu/thredds/wms/METOFFICE-GLO-SST-L4-NRT-OBS-SKIN-DIU-FV01.1"
	//var WMS = '?service=WMS&request=GetMap&version=1.1.1&layers=analysed_sst&styles=&format=image%2Fpng&transparent=true&width=200&height=200&srs=EPSG:3857&bbox=';

    //Global Ocean - SST Multi-sensor L3 Observations
    //var URL="http://nrt.cmems-du.eu/thredds/wms/IFREMER-GLOB-SST-L3-NRT-OBS_FULL_TIME_SERIE";
    //var WMS="?service=WMS&request=GetMap&version=1.1.1&layers=adjusted_sea_surface_temperature&styles=&format=image%2Fpng&transparent=true&width=200&height=200&srs=EPSG:4326&bbox=";
	
	var base = L.tileLayer.wms(URL, {
		layers: 'analysed_sst', //cambiar la capa. Comprobar con ?service=WMS&request=GetCapabilities
		format: 'image/png',
		transparent: true,
        styles: 'boxfill/rainbow',
    	version: "1.3.0",
        //time: '2022-08-02T16:00:00.000Z',
		attribution: "© <a target='_blank' href='https://resources.marine.copernicus.eu/product-detail/SST_GLO_SST_L4_NRT_OBSERVATIONS_010_001/INFORMATION'>Copernicus Marine Service & MetOffice ◳</a>"
	}).addTo(map);
	
	//Obtener última hora de actualizacion del mapa
	var timeInp=document.getElementById("timeInp");
	var t;
    var maxT;
    var minT;
	var xTime = new XMLHttpRequest();
		xTime.onreadystatechange = function(){
			if (this.readyState == 4 && this.status == 200) {
				//convertimos el XML según https://www.w3schools.com/xml/xml_parser.asp
                var xmlDoc=this.responseXML;
                t=xmlDoc.children[0].children[1].children[2].children[12].children[1].children[5].attributes[4].value;
                //Lo convertimos en un objeto fecha quitando los segundos
        		t=new Date(t);
                t=t.toISOString().substring(0,t.toISOString().length-8);
            	console.log(t);
                //Lo pasamos al selector y lo establecemos como máximo
                timeInp.max=t;
                timeInp.value=t;
                maxT=new Date(t);

                //también establecemos el minimo
                t=xmlDoc.children[0].children[1].children[2].children[12].children[1].children[5].innerHTML.trim();
                t=t.substring(0,16);
                timeInp.min=t;
                minT=new Date(t);
			}
		};
		
		xTime.open("GET", URL+"?service=WMS&request=GetCapabilities");
		xTime.send();
	
	//Selector de fecha para WMS
		
	timeInp.addEventListener("change", function(){
		t=new Date(timeInp.value.toString());
        t.setHours(12-t.getTimezoneOffset()/60);
        t=t.toISOString().substring(0,t.toISOString().length-8);
	    timeInp.value=t;
	    t=new Date(timeInp.value);
    	t.setHours(12-t.getTimezoneOffset()/60);
        //t=t.toISOString().substring(0,t.toISOString().length-13)+"14:00";

        //si estamos en el rango de datos..
        if(t>=minT && t<=maxT){
		    t=t.toISOString();
            //actualziamos el mapa
		    base.setParams({
			    time: t,
			    styles: "boxfill/rainbow",
		    },0);
        }else{//mostramos error
            alert("La fecha introducida está fuera de rango.");
        }
	});

    //funcion de reinicio de fecha
    function reiniT(){
        timeInp.value=maxT.toISOString().substring(0,maxT.toISOString().length-13)+"12:00";
    }

    //Generar la leyenda
	
	function grad(){
		//Generamos la leyenda en el canvas 'gradientC'
		var ctx=document.getElementById("gradientC").getContext('2d');
		//Definimos un gradiente lineal
		var grd=ctx.createLinearGradient(0,150,0,0);
		//Calibrar las paradas del gradiente tomando muestras de la imagen
		//Descomentar la imagen que va junto al canvas en el html
		//Usar HTML color picker: https://www.w3schools.com/colors/colors_picker.asp
		grd.addColorStop(0, "rgb(0, 0, 146)");			//0 -> -3.15
		grd.addColorStop(0.09, "rgb(0, 0, 247)");		//1
		grd.addColorStop(0.185, "rgb(1, 61, 255)");		//2
		grd.addColorStop(0.26, "rgb(0, 146, 254)");		//3
		grd.addColorStop(0.3075, "rgb(0, 183, 255)");		//4
		grd.addColorStop(0.375, "rgb(3, 251, 252)");	//5
		grd.addColorStop(0.5, "rgb(111, 255, 144)");	//6 -> 20.0
		grd.addColorStop(0.575, "rgb(191, 255, 62)");	//7
		grd.addColorStop(0.64, "rgb(255, 255, 30)");	//8
		grd.addColorStop(0.74, "rgb(255, 162, 1)");		//9
		grd.addColorStop(0.805, "rgb(255, 83, 0)");		//10
		grd.addColorStop(0.90, "rgb(252, 4, 1)");		//11
		grd.addColorStop(1, "rgb(144, 0, 0)");			//12 -> 36.85
		
		//añadir el gradiente al canvas
		ctx.fillStyle = grd;
		ctx.fillRect(0,0,255,255);
	}
	
	//ejecutamos la funcion del gradiente al inicio
	grad();
	
	//Añadimos función al hacer click en el mapa
	map.addEventListener('click', onMapClick);
	
	function onMapClick(e) {
		//ejecutamos la función grad con cada click
		grad();
		//Obtenemos las coordenadas del pinto seleccionado
        var latlngStr = '(' + e.latlng.lat.toFixed(3) + ', ' + e.latlng.lng.toFixed(3) + ')';
		//console.log(latlngStr);

		//Definir el CRS para enviar la consulta al WMS
		const proj = L.CRS.EPSG3857;
        //const proj = L.CRS.EPSG4326;
		
		//Definimos los límites del mapa que pediremos al WMS para que sea aproximadamente de 1 pixel
		var BBOX=((proj.project(e.latlng).x)-10)+","+((proj.project(e.latlng).y)-10)+","+((proj.project(e.latlng).x)+10)+","+((proj.project(e.latlng).y)+10);
		
		//Restablecemos la imagen en cada click
		var tTxt=document.getElementById("tempTxt");
		var pix= document.getElementById("pixel");
		var ctx=document.getElementById("temp").getContext("2d");
		ctx.fillStyle="lightgrey";
		ctx.fillRect(0,0,300,300);
		
		//Realizamos la petición del pixel seleccionado
		var xPix= new XMLHttpRequest();
		xPix.onreadystatechange = function(){
			if (this.readyState == 4 && this.status == 200) {
				pix.src=URL+WMS+BBOX;
				pix.onload=function(){
					ctx.drawImage(pix,0,0,300,300);
					tTxt.innerHTML="INTERPRETANDO LEYENDA...";
					//Interpretamos el pixel según la leyenda
					leyenda();
				}
				pix.crossOrigin="anonymous";
			}
		};
		
		xPix.open("GET", URL+WMS+BBOX);
		xPix.send();
		
		tTxt.innerHTML="CARGANDO TEMPERATURA...";


    }
	function leyenda(){
		var ctx=document.getElementById("temp").getContext("2d");
		var tTxt=document.getElementById("tempTxt");
		//obtenemos el valor RGB del pixel seleccionado
		var RGB=ctx.getImageData(5,5,1,-1).data;
		
		var key=document.getElementById("gradientC").getContext("2d");
		var max=150;
		
		var min=1000;//la máxima diferencia sólo puede ser de 255x3=765
		var dif="";
		var val="";
		
		//recorremos el gradiente de la leyenda pixel a pixel para obtener el valor de temperatura
		for(var p=1;p<=max;p++){
			//obtenemos el valor actual
			var temp=key.getImageData(1,p,1,-1).data;
			//comparamos con el seleccionado y obtenemos la diferencia total
			dif=Math.abs(parseInt(temp[0])-parseInt(RGB[0]))+Math.abs(parseInt(temp[1])-parseInt(RGB[1]))+Math.abs(parseInt(temp[2])-parseInt(RGB[2]));
			if(dif<min){
				min=dif;
				val=p;
			}
		}
		var T=36.85-(val*40/max);
		T=T.toFixed(2);
		//pintamos una línea de referencia en la leyenda
		key.fillStyle="#ffffff";
		key.fillRect(0,val,255,1);
		
		//definimos la temperatura en el texto
		//si el color da gris, hemos pinchado en la tierra
		if(RGB[0]==211&RGB[1]==211&RGB[2]==211){
			tTxt.innerHTML="PINCHA SOBRE EL MAR PARA CONOCER SU TEMPERATURA";
		}else if(typeof T == "undefined"){
			tTxt.innerHTML="¡ERROR!<BR>PRUEBA OTRO PUNTO DEL MAR.";
		}else{
			tTxt.innerHTML="TEMPERATURA APROXIMADA: <br><br>"+T+" ºC";
		}
	
	}

</script>

</html>

All AEMET station data on one click in your phone

The Spanish Meteorological State Agency (AEMET) provides an open data API that we can use to access most of the data published in their website.

AEMET OpenData API

This way, any user can create simple apps only with the information needed and without accessing their website.

In my case, I want to show station data intuitively in a web map that can be accessed from any internet device, such as a smartphone.

Here’s a preview to keep you reading:

Define a base map

I'll use all the potential of Leaflet JS and the open maps from the Spanish National Geographic Institute.

In this case, we only need a simple map:

  1. Create an .html document with its basic structure:
<!DOCTYPE HTML>
<html>

<head>

<style>

</style>

</head>

<body>

</body>

<script>

</script>

</html>
  1. Link the Leaflet libraries inside <head> tags:

I also add <meta> charset(1) and viewport(2) properties to (1)correctly read special characters in the data and (2) adjust the window correctly for mobile devices.

<head>
    <meta charset="utf-8" />
    <meta name="viewport" content="width=device-width, initial-scale=1.0, maximum-scale=1.0, user-scalable=no">

    <link rel="stylesheet" href="https://unpkg.com/[email protected]/dist/leaflet.css"
       integrity="sha512-xodZBNTC5n17Xt2atTPuE1HxjVMSvLVW9ocqUKLsCC5CXdbqCmblAshOMAS6/keqq/sMZMZ19scR4PsZChSR7A=="
       crossorigin=""/>
    <script src="https://unpkg.com/[email protected]/dist/leaflet.js"
       integrity="sha512-XQoYMqMTK8LvdxXYG3nZ448hOEQiglfqkJs1NOQV44cWnUrBc8PkAOcXy20w0vlaXaVUearIOBhiXZ5V3ynxwA=="
       crossorigin=""></script>

<style>

</style>

</head>
  1. Define the Leaflet map element inside the <body>
<body style="border:0;margin:0;">
    
    <div id="mapa" style="width:100vw; height:100vh;z-index:0"></div>

</body>

As you can see, I add border:0 and margin:0 to <body> style. This adjusts the map to fit the window without white spaces.

Height:100vh and width:100vw adjust the map to fit the size of the screen, even when we resize (view height and view width). z-index will be used to place elements in order and avoid overlays.

  1. Now we can generate the map with javascript in the <script> block.

With L.map we define the map and the initial view (centered in Madrid).

With L.tileLayer.wms we add the WMS service to get an "onlin" basemap. You can find the URLs for each service in the metadata files that come with each product.

It's also usual that WMS come with several layers and we need to define one. We can get a list of layers using the GetCapabilities WMS function. In my case, its the <Layer> with <Name> "IGNBaseTodo-gris" found here:

https://www.ign.es/wms-inspire/ign-base?service=WMS&request=GetCapabilities

<script>
var o = L.map('mapa').setView([40.5, -3.5], 8);

var IGN = window.L.tileLayer.wms("https://www.ign.es/wms-inspire/ign-base", {
    		layers: 'IGNBaseTodo-gris',
    		format: 'image/png',
    		transparent: true,
    		attribution: "BCN IGN © 2022"
		});
IGN.addTo(o);
</script>

Joining all this we'll have a basic map:

App leafMET.js

Now we add the plugin for downloading and plotting AEMET data (leafMET) that you can find in my github.

You can download leafMET.js and add it as a local script, or link it directly from this site. Inside the <head> tags we add the following:

<script type="application/javascript" src="https://theroamingworkshop.cloud/leafMET/leafMET.js"></script>

.html shortcut

Finally, to see the app in one click on a smartphone, you need to copy the content in leafMET.js and add it inside the <script> tags in the .html

This way, you'll have a single file with all it's needed to run the webapp. I added <title> and "icon" tags in the <head> to show a page title and an icon in the shortcut.

It should all look like this:

<!DOCTYPE HTML>
<html lang="en">

<head>
    <title>leafMET</title> 
    <meta charset="utf-8" />
    <meta name="viewport" content="width=device-width, initial-scale=1.0, maximum-scale=1.0, user-scalable=no">

    <link rel="icon" href="data:image/svg+xml,<svg xmlns=%22http://www.w3.org/2000/svg%22 viewBox=%220 0 100 100%22><text y=%22.9em%22 font-size=%2290%22>🌤</text></svg>">

    <link rel="stylesheet" href="https://unpkg.com/[email protected]/dist/leaflet.css"
       integrity="sha512-xodZBNTC5n17Xt2atTPuE1HxjVMSvLVW9ocqUKLsCC5CXdbqCmblAshOMAS6/keqq/sMZMZ19scR4PsZChSR7A=="
       crossorigin=""/>
    <script src="https://unpkg.com/[email protected]/dist/leaflet.js"
       integrity="sha512-XQoYMqMTK8LvdxXYG3nZ448hOEQiglfqkJs1NOQV44cWnUrBc8PkAOcXy20w0vlaXaVUearIOBhiXZ5V3ynxwA=="
       crossorigin=""></script>

    <script type="application/javascript" src="https://theroamingworkshop.cloud/leafMET/leafMET.js"></script>

<style>


</style>
</head>

<body style="border:0;margin:0;">
    
    <div id="mapa" style="width:100vw; height:100vh;z-index:0"></div>

</body>

<script>
//Create Leaflet map and load OSM layer
var o = L.map('mapa').setView([40.5, -3.5], 8);

        var IGN = window.L.tileLayer.wms("https://www.ign.es/wms-inspire/ign-base", {
    		layers: 'IGNBaseTodo-gris',
    		format: 'image/png',
    		transparent: true,
    		attribution: "BCN IGN © 2022"
		});
IGN.addTo(o);


leafMET(o);
o.on('moveend', colocaEnLaVista);

var datosMET=null;
var sta=[];
var pinta="cross";
var ini=0;
var map="";

function leafMET(m){

    map=m;
    //Create button
    var btmet = window.document.createElement("BUTTON");
    btmet.id="btmet";
    btmet.title="Cargar datos meteorológicos";
    btmet.innerHTML="<b>🌤</b>";
    btmet.style.zIndex="1000";
    btmet.style.position="absolute";
    btmet.style.top="100px";
    btmet.style.left="10px";
    btmet.style.fontSize="16px";
	btmet.style.textAlign="center";
    btmet.style.width="35px";
    btmet.style.height="35px";
    btmet.style.background="Turquoise";
	btmet.style.border="0px solid black";
    btmet.style.borderRadius="5px";
    btmet.style.cursor="pointer";
    btmet.addEventListener("click", pintaMET);
    window.document.body.appendChild(btmet);
    //Create subtitle
    var mtxt = window.document.createElement("P");
    mtxt.id="mtxt";
    mtxt.innerHTML="<b>Carga</b>";
    mtxt.title="Cargar datos meteorológicos";
    mtxt.style.zIndex="1000";
    mtxt.style.position="absolute";
    mtxt.style.top="130px";
    mtxt.style.left="7px";
    mtxt.style.fontSize="10px";
	mtxt.style.textAlign="center";
    mtxt.style.width="40px";
    mtxt.style.height="15px";
    mtxt.style.background="DarkOrange";
	mtxt.style.border="0px solid black";
    mtxt.style.borderRadius="2px";
    mtxt.style.cursor="context-menu";
    mtxt.style.fontFamily="Arial";
    window.document.body.appendChild(mtxt);
    //Create key
    for (var i=1; i<=6;i++){
        var mkey = window.document.createElement("P");
        mkey.id="mkey"+i;
        mkey.innerHTML="<b>"+i+"</b>";
        mkey.style.zIndex="1000";
        mkey.style.position="absolute";
        var pos = 140+i*16;
        pos = pos+"px";
        mkey.style.top=pos;
        mkey.style.left="7px";
        mkey.style.fontSize="10px";
	    mkey.style.textAlign="center";
	    mkey.style.textIndent="0px";
        mkey.style.width="40px";
        mkey.style.height="15px";
        mkey.style.background="DarkOrange";
        mkey.style.opacity="0.75";
	    mkey.style.border="0px solid black";
        mkey.style.borderRadius="2px";
        mkey.style.cursor="context-menu";
        mkey.style.fontFamily="Arial";
        mkey.style.fontWeight="bold";
        mkey.style.color="black";
        mkey.style.display="none";
        window.document.body.appendChild(mkey);
    }
}

//Create loading message
function loader(){
    var ldmet = window.document.createElement("P");
    ldmet.id="ldmet";
    ldmet.innerHTML="CARGANDO DATOS METEOROLÓGICOS";
    ldmet.style.zIndex="1000";
    ldmet.style.position="relative";
    ldmet.style.top="-50vh";
    ldmet.style.width="250px";
	ldmet.style.margin="auto";
	ldmet.style.textAlign="center";
    ldmet.style.background="DarkOrange";
    ldmet.style.fontWeight="bold";
    ldmet.style.fontSize="11px";
    ldmet.style.padding="4px 4px 4px 4px";
    ldmet.style.fontFamily="Arial";
    window.document.body.appendChild(ldmet);
}


function getAEMET(){
    //show loading message
    loader();
    //http GET request to data
    var data = null;

    var xhr = new XMLHttpRequest();
    var xhd = new XMLHttpRequest();
    xhr.withCredentials = true;
    xhd.withCredentials = true;

    xhr.onload= function () {
        var consulta= JSON.parse(this.responseText);
        xhd.open("GET", consulta.datos);
        xhd.send();
    }
    xhd.onload= function () {
        data= JSON.parse(this.responseText);
        loadAEMET(data);
    }

    xhr.open("GET", "https://opendata.aemet.es/opendata/api/observacion/convencional/todas?api_key=eyJhbGciOiJIUzI1NiJ9.eyJzdWIiOiJyb21hbmhkZXpnb3JyaW5AZ21haWwuY29tIiwianRpIjoiZmFiMTM1N2QtNTJhMC00ZWQ1LWFkNzYtNjY5YTAzNGI4YTFlIiwiaXNzIjoiQUVNRVQiLCJpYXQiOjE1NzAxMjM2MzIsInVzZXJJZCI6ImZhYjEzNTdkLTUyYTAtNGVkNS1hZDc2LTY2OWEwMzRiOGExZSIsInJvbGUiOiIifQ.-7vQF_TJLghx3g4t3GiHzlWt52LpMChqqtfNUhW07LQ");
    xhr.setRequestHeader("cache-control", "no-cache");
    xhr.send(data);
}

function loadAEMET(d){
    var obj=d.length;

    //loop to plot stations (s) as circles using station coordinate data
    for (var s=0; s < obj; s++){
        sta[s]=window.L.circle([d[s].lat, d[s].lon],{radius: 5000, weight: 0, opcaity: 0.0, fillColor: "RoyalBlue", fillOpacity: 0.01});
        //add name data
        sta[s].title=d[s].ubi;
        //add data values (temp, wind speed and rain)
        sta[s].temp=d[s].ta;
        sta[s].viento=d[s].vmax;
        sta[s].lluvia=d[s].prec;

        var prop="<p><b>"+d[s].ubi+"</b></p>";
        prop=prop+"<p>"+d[s].fint+"</p>";
        prop=prop+"<p><b>Temperatura: </b>"+sta[s].temp+" ºC</p>";
        prop=prop+"<p><b>Viento: </b>"+sta[s].viento+" km/h</p>";
        prop=prop+"<p><b>Lluvia: </b>"+sta[s].lluvia+" mm</p>";
        sta[s].bindPopup(prop);
    }
    //remove loading message
    window.document.getElementById("ldmet").style.display="none";
    //update stations visible in view
    colocaEnLaVista();
}

function colocaEnLaVista(){
    //Plot only stations visible in view bounds
    var vista=o.getBounds();
    for (var s in sta){
    sta[s].setStyle({fillOpacity: 0.01,fill: 0.01});
        if(vista.contains(sta[s].getLatLng())){
            var cobertura=o.distance(o.getBounds().getNorthEast(),o.getBounds().getSouthEast());
            sta[s].setRadius(cobertura/30);
            sta[s].addTo(map);
        }else if(sta[s]){
            sta[s].remove();
        }
    //edit stations display color according to data value
    switch(pinta){
    case "viento":
        if (sta[s].viento==null || sta[s].viento<0){
            sta[s].setStyle({fillOpacity: 0.0,fill: 0.0, cursor: "none"});
        }else if (sta[s].viento>=0 && sta[s].viento<5){
            sta[s].setStyle({fillColor: "green"});
        }else if (sta[s].viento>=5 && sta[s].viento<10){
            sta[s].setStyle({fillColor: "yellow"});
        }else if (sta[s].viento>=10 && sta[s].viento<20){
            sta[s].setStyle({fillColor: "orange"});
        }else if (sta[s].viento>=20 && sta[s].viento<30){
            sta[s].setStyle({fillColor: "red"});
        }else if (sta[s].viento>=30 && sta[s].viento<500){
            sta[s].setStyle({fillColor: "purple"});
        }
    break;
    case "lluvia":
        if (sta[s].lluvia==null || sta[s].lluvia<=0){
            sta[s].setStyle({fillOpacity: 0.0, fill: 0.0, cursor: "none"});
        }else if (sta[s].lluvia>0 && sta[s].lluvia<2){
            sta[s].setStyle({fillColor: "LightCyan"});
        }else if (sta[s].lluvia>=2 && sta[s].lluvia<5){
            sta[s].setStyle({fillColor: "LightSkyBlue"});
        }else if (sta[s].lluvia>=5 && sta[s].lluvia<10){
            sta[s].setStyle({fillColor: "SkyBlue"});
        }else if (sta[s].lluvia>=10 && sta[s].lluvia<20){
            sta[s].setStyle({fillColor: "DodgerBlue"});
        }else if (sta[s].lluvia>=20 && sta[s].lluvia<30){
            sta[s].setStyle({fillColor: "Blue"});
        }else if (sta[s].lluvia>=30 && sta[s].lluvia<500){
            sta[s].setStyle({fillColor: "DarkBlue"});
        }
    break;
    case "temp":
        if (sta[s].temp==null || sta[s].temp<=0){            
            sta[s].setStyle({fillOpacity: 0.0, fill: 0.0, cursor: "none"});
        }else if (sta[s].temp>0 && sta[s].temp<5){
            sta[s].setStyle({fillColor: "LightCyan"});
        }else if (sta[s].temp>=5 && sta[s].temp<10){
            sta[s].setStyle({fillColor: "DodgerBlue"});
        }else if (sta[s].temp>=10 && sta[s].temp<20){
            sta[s].setStyle({fillColor: "SpringGreen"});
        }else if (sta[s].temp>=20 && sta[s].temp<30){
            sta[s].setStyle({fillColor: "Gold"});
        }else if (sta[s].temp>=30 && sta[s].temp<100){
            sta[s].setStyle({fillColor: "DarkOrange"});
        }
    break;
    case "cross":     
            sta[s].remove();
    break;
    }
    }
}

function pintaMET(){
    //only download data at start
	if(ini==0){
    getAEMET();
    ini=1;
    }
    //empty legend
    for (var i=1; i<=6;i++){
        window.document.getElementById("mkey"+i).style.display= "none";
        window.document.getElementById("mkey"+i).style.color="black";
        }
    //generate new legend for each type of data
    //(using the current icon to define the next key)
    if (pinta=="cross"){
        pinta="temp";
        window.document.getElementById("btmet").innerHTML="🌡";
    	window.document.getElementById("btmet").title="Temperatura (ºC)";
        window.document.getElementById("mtxt").innerHTML="<b>T (ºC)</b>";
        window.document.getElementById("mtxt").title="Temperatura (ºC)";
        //set key
        mkey1.style.display="block";
        mkey1.style.background="LightCyan";
        mkey1.innerHTML="0 - 5";
        mkey2.style.display="block";
        mkey2.style.background="DodgerBlue";
        mkey2.innerHTML="5 - 10";
        mkey3.style.display="block";
        mkey3.style.background="SpringGreen";
        mkey3.innerHTML="10 - 20";
        mkey4.style.display="block";
        mkey4.style.background="Gold";
        mkey4.innerHTML="20 - 30";
        mkey5.style.display="block";
        mkey5.style.background="DarkOrange";
        mkey5.innerHTML="> 30";
    }else if(pinta=="temp"){
        pinta="viento";
        window.document.getElementById("btmet").innerHTML="🌪";
    	window.document.getElementById("btmet").title="Viento (Km/h)";
        window.document.getElementById("mtxt").innerHTML="<b>V(km/h)</b>";
        window.document.getElementById("mtxt").title="Viento (Km/h)";
        //set key
        mkey1.style.display="block";
        mkey1.style.background="green";
        mkey1.innerHTML="0 - 5";
        mkey2.style.display="block";
        mkey2.style.background="yellow";
        mkey2.innerHTML="5 - 10";
        mkey3.style.display="block";
        mkey3.style.background="orange";
        mkey3.innerHTML="10 - 20";
        mkey4.style.display="block";
        mkey4.style.background="red";
        mkey4.innerHTML="20 - 30";
        mkey4.style.color="white";
        mkey5.style.display="block";
        mkey5.style.background="purple";
        mkey5.innerHTML="> 30";
        mkey5.style.color="white";
    }else if(pinta=="lluvia"){
        pinta="cross";
        window.document.getElementById("btmet").innerHTML="❌";
    	window.document.getElementById("btmet").title="Sin clima";
        window.document.getElementById("mtxt").innerHTML="<b>-</b>";
        window.document.getElementById("mtxt").title="Sin clima";
    }else if(pinta=="viento"){
        pinta="lluvia";
        window.document.getElementById("btmet").innerHTML="☔";
    	window.document.getElementById("btmet").title="Precipitación (l/m²)";
        window.document.getElementById("mtxt").innerHTML="<b>P (mm)</b>";
        window.document.getElementById("mtxt").title="Precipitación (l/m²)";
        //set key
        mkey1.style.display="block";
        mkey1.style.background="LightCyan";
        mkey1.innerHTML="0 - 2";
        mkey2.style.display="block";
        mkey2.style.background="LightSkyBlue";
        mkey2.innerHTML="2 - 5";
        mkey3.style.display="block";
        mkey3.style.background="SkyBlue";
        mkey3.innerHTML="5 - 10";
        mkey4.style.display="block";
        mkey4.style.background="DodgerBlue";
        mkey4.innerHTML="10 - 20";
        mkey5.style.display="block";
        mkey5.style.background="Blue";
        mkey5.innerHTML="20 - 30";
        mkey5.style.color="white";
        mkey6.style.display="block";
        mkey6.style.background="DarkBlue";
        mkey6.innerHTML="> 30";
        mkey6.style.color="white";
    }
    //update stations visible in view
    colocaEnLaVista();
}


</script>

</html>

Also, you can directly download the leafMET.html from my github and open in a browser in your phone.

Was the post useful? Do you have doubts or comments? Come by Twitter and let me know! See you next time!

🐦 @RoamingWorkshop

Spotify for Raspberry without Premium

Blocking page when accessing Spotify via Firefox ESR or Chromium

You would have thought that you could just plug your Raspberry Pi to your monitor and play some background music on Spotify through your browser from the usual open.spotify.com. Well, you probably found the message above and ran in circles for a while until you got here. Glad I can help!

Increased security on Spotify makes it only available via 64bit versions of Chrome, Firefox and Edge which restrict hacking and fraudulent streaming without a premium account.

Premium.

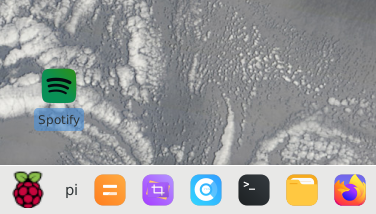
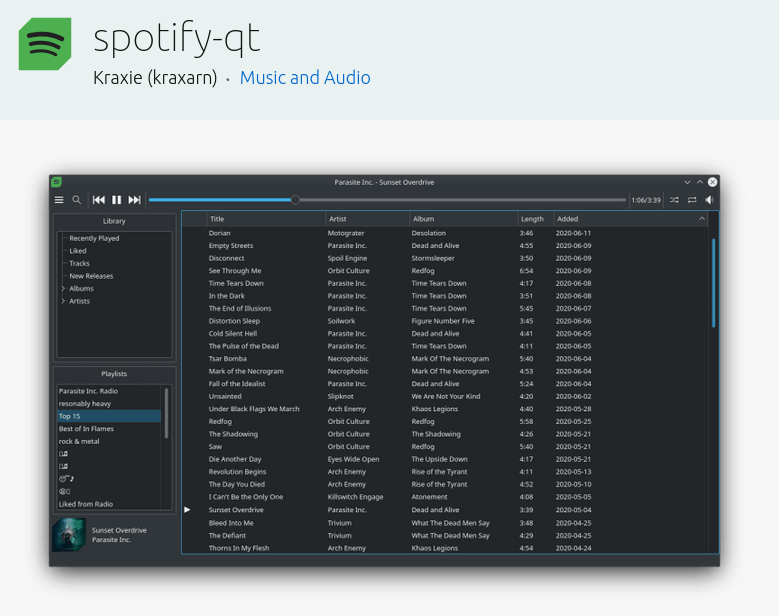
If you have a premium account, go the easy way and make use of one of the apps available like Raspicast (to stream from your phone), Raspotify and spotify-qt, which will grant you access to your music with some little config.

spotify-qt from snapcraft.io

Non-Premium.

For those of us who love listening to ads (and not paying a buck), the journey is not that hard. We just need to install the Widevine library:

sudo apt-get install libwidevinecdm0

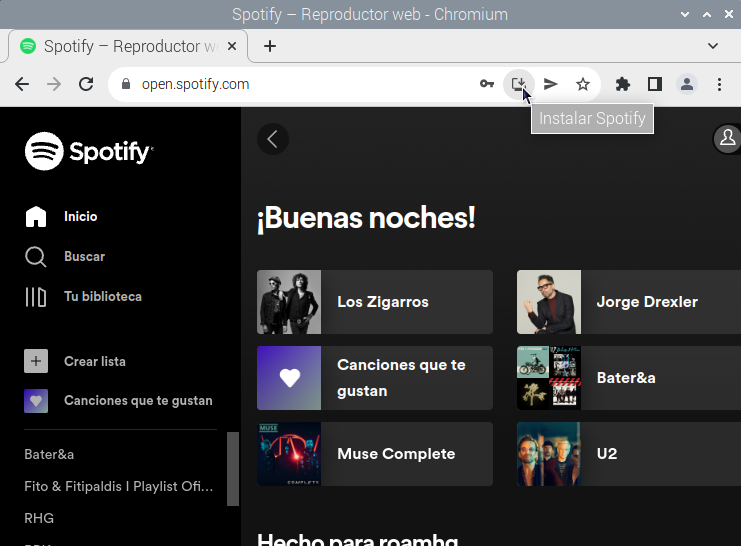
Then we reboot the system and access open.spotify.com via Chromium.

Log in and you should see the usual interface without the previous annoying message.

Lastly, we can install a shortcut in our desktop using the button in the navigation bar. And that´s it! Now you can fully enjoy Spotify on your Raspberry!

Spotify web in Chromium Browser for Raspberry Pi

Any issues or comments, let me know via Twitter 🐦! See you soon!

🐦 @RoamingWorkshop

Free Web Map Services (WMS) and demos for Leaflet JS.

Here I will be dropping a few samples of cool stuff that you can do with Leaflet JS.

TIP! You can directly copy and paste the codes below in a text file with .html extension and preview locally in a browser.

1. World-wide greyscale locked header.


Features:

  • Free greyscale OSM mapping by ESRI.
  • World-wide zoom level: L.map zoom level set to 0.
  • Disabled user controls, turning it into a locked view.
  • Fixed height added to the div element style.
  • Custom attribution text with hyperlink.

See the details in the source code below.

<!DOCTYPE html>
<html>

<head>
<meta http-equiv="Content-Type" content="text/html; charset=UTF-8">

<link rel="stylesheet" href="https://unpkg.com/[email protected]/dist/leaflet.css"
  integrity="sha512-xodZBNTC5n17Xt2atTPuE1HxjVMSvLVW9ocqUKLsCC5CXdbqCmblAshOMAS6/keqq/sMZMZ19scR4PsZChSR7A=="
  crossorigin=""/>
<script src="https://unpkg.com/[email protected]/dist/leaflet.js"
  integrity="sha512-XQoYMqMTK8LvdxXYG3nZ448hOEQiglfqkJs1NOQV44cWnUrBc8PkAOcXy20w0vlaXaVUearIOBhiXZ5V3ynxwA=="
  crossorigin=""></script>

</head>

<style>

</style>

<body>
	<div id="mapid2" style="height:100px;"></div> <! fixed height set as a style property >
</body>

<script>

//leaflet map object
var map = L.map('mapid2',{
	zoomControl:false,//disabling interaction
	dragging:false,//disabling interaction
	maxZoom:0,//disabling interaction
	minZoom:0,//disabling interaction
	doubleClickZoom:false,//disabling interaction
}).setView([20, -40], 0);//initial zoom level to 0

//tiled basemap object
var googleMaps = L.tileLayer("https://server.arcgisonline.com/ArcGIS/rest/services/Canvas/World_Dark_Gray_Base/MapServer/tile/{z}/{y}/{x}", {
	attribution: 'Sample <b>worldwide locked demo</b> by <a href="https://theroamingworkshop.cloud">The Roaming Workshop</a>. Uses ESRI tiles.',
}).addTo(map); //custom attribution text with hyperlink

</script>
</html>

2. ESRI+National Geographic interactive country spotter.


Features:

See the details in the code below:

<!DOCTYPE html>
<html>

<head>
<meta http-equiv="Content-Type" content="text/html; charset=UTF-8">

<link rel="stylesheet" href="https://unpkg.com/[email protected]/dist/leaflet.css"
  integrity="sha512-xodZBNTC5n17Xt2atTPuE1HxjVMSvLVW9ocqUKLsCC5CXdbqCmblAshOMAS6/keqq/sMZMZ19scR4PsZChSR7A=="
  crossorigin=""/>
<script src="https://unpkg.com/[email protected]/dist/leaflet.js"
  integrity="sha512-XQoYMqMTK8LvdxXYG3nZ448hOEQiglfqkJs1NOQV44cWnUrBc8PkAOcXy20w0vlaXaVUearIOBhiXZ5V3ynxwA=="
  crossorigin=""></script>

<!-- Load Esri Leaflet from CDN -->
<script src="https://unpkg.com/esri-leaflet/dist/esri-leaflet.js"></script>
<script src="https://theroamingworkshop.cloud/b/wp-content/uploads/2021/08/countries.txt"></script>

<!-- Load Lealeft Control Custom by yigityuce -->
<script src="https://theroamingworkshop.cloud/b/wp-content/uploads/2021/08/Leaflet-Control-Custom.txt"></script>

<!-- FONT AWESOME CDN -->
<link rel="stylesheet" href="https://maxcdn.bootstrapcdn.com/font-awesome/4.7.0/css/font-awesome.min.css">

</head>

<style>

</style>

<body>
	<div id="mapid3" style="height:600px;"></div> <! fixed size set as a style property >
</body>

<script>

//leaflet map object
var map = L.map('mapid3',{
	zoomControl:false,
	maxBounds:[[-90,-180],[90,180]],
});
map.setView([30, 0], 3);

//Define ESRI maps
var natgeomap = L.esri.basemapLayer("NationalGeographic");
var graymap = L.esri.basemapLayer("Terrain");

//Add unlabeled layer to map
graymap.addTo(map);


//Set map style
var layerstyle = {
	weight: 0.5,
	color: "grey",
	dashArray: "5",
	fillOpacity: 0,
	};


function mouseOver(feature, layer, e){
	layer.on({
		mouseover: highlight,
		mouseout: restore,
		click: focus,
	});
} 

function highlight(e){
	var layer = e.target;

	layer.setStyle({
	color:"red",
	weight: 2,
	});

	coords=layer.getBounds().getCenter();
	country=e.target.feature.properties.name;
	
	//fix known issues with browsers
    	
	if (!L.Browser.ie && !L.Browser.opera && !L.Browser.edge) {
		layer.bringToFront();
    	}
}

function restore(e){
	var layer = e.target;

	layer.setStyle(layerstyle);
	
	//fix known issues with browsers
    	
	if (!L.Browser.ie && !L.Browser.opera && !L.Browser.edge) {
		layer.bringToFront();
    	}
}

//instantiate label object
var label;

function focus(e){
	label = L.tooltip().setContent(country+" !!").setLatLng(coords);
	label.addTo(map);
	map.fitBounds(e.target.getBounds());
//	graymap.remove;
	map.removeLayer(graymap);
	natgeomap.addTo(map);
}

//Add home (reset) button

L.control.custom({
	position: 'topleft',
	content: '<button type="button" class="btn btn-default">'+
		'	<i class="fa fa-home"></i>'+
		'</button>',
	style:{
		
		},
	events:{
		click: function(){
			map.setView([30, 0], 3);
			map.removeLayer(natgeomap);
			graymap.addTo(map);
			map.removeLayer(label);
			}
		},
	}).addTo(map);

L.control.zoom().addTo(map);

//Add geoJson layer
L.geoJson(countries, {
	style: layerstyle,
	onEachFeature: mouseOver,
	}).addTo(map);

</script>
</html>

LeafletJS: free maps for your site.

Leaflet JS is one of the most exciting discoveries I’ve come across in the latest years. It is one of the most powerful mapping libraries you’ll find around, competing with Google’s API, ESRI and Mapbox thanks to its great community and the awesome plugins that have been developed for it.

Open-source FTW 🤟

(See the code for above map in this post with a few more Leaflet samples)

1. Set up.

All you need to use Leaflet JS is the following:

  • A web browser with html and javascript compatibility (any modern browser like Firefox, Opera, Chrome, Edge, Vivaldi, etc will do).
  • Any text editor.
    • [OPTIONAL] A web server to host your resulting webpage and make it accessible via internet. In any case, you can always run the file locally except for some special features.

2. Integrating Leaflet JS in any webpage.

Being a library, you only need to link its scripts to make use of it.

Start by creating a new file with a basic html structure and extension .html. I always use and recommend w3schools for any help:

Add Leaflet's funcitonalities to the HTML file by including the following code inside some <head> tags:

<head>
.....
<link rel="stylesheet" href="https://unpkg.com/[email protected]/dist/leaflet.css"
  integrity="sha512-xodZBNTC5n17Xt2atTPuE1HxjVMSvLVW9ocqUKLsCC5CXdbqCmblAshOMAS6/keqq/sMZMZ19scR4PsZChSR7A=="
  crossorigin=""/>
<script src="https://unpkg.com/[email protected]/dist/leaflet.js"
  integrity="sha512-XQoYMqMTK8LvdxXYG3nZ448hOEQiglfqkJs1NOQV44cWnUrBc8PkAOcXy20w0vlaXaVUearIOBhiXZ5V3ynxwA=="
  crossorigin=""></script>
.....
</head>

This method will read the library from the internet, but you can download the library files from Leaflet's website to your PC and make proper reference to the local files in your html code:https://leafletjs.com/download.html

<link rel="stylesheet" href="/path/to/leaflet.css" />
<script src="/path/to/leaflet.js"></script>

This options will make use of a local copy of the library and won't be affected by changes to the live repository. It also allows you to adapt the code locally to suit your application.

3. Adding a map to html <body> with Leaflet JS

Location inside html <body>

Leaflet will add its components inside a <div> element which you can place anywhere inside your html <body> tags to suit your design. You need to specify a div "id" in order to refer to it later. I am using "mapid" for this example:

<div id="mapid" style="height:500px;"></div>

The map will be affected by CSS properties assigned to the div tag (#mapid in my case). This will modify how the div element fits and looks in your website.

As an example, I'll modify the frame to be round with a 30px radius, instead of the default square edge. We'll add this code as CSS inside <style> tags. Uncomment these lines to see the difference.

<style>
#mapid{border-radius: 30px;}
</style>

Define the map in javascript

Let's now add the map object itself. This is done using the library functions (which start with L). We'll add all this function inside the <script> tags as they make use of javascript.

  • Define the map object. Make use of the function "L.map" and refer to the "mapid" div element. Then define the start view coordinates and zoom level with "L.setView".

    I am going to set the center of the view approximately in Miami (make a google search and extract its latitude and logitude coordinates: 25.75, -80.2. The zoom range will be set to 12 so it's close enough. Larger values mean bigger zoom in and smaller values provide a wider view.
var map = L.map('mapid').setView([25.75, -80.2], 12);
  • Define the base layer. Web-based maps make use of tiled images which are loaded dinamically according to your navigation across the map. We can use the "L.tileLayer" function and any of the following tiled services very well put together in this post, which includes Open Street Maps (OSM), Google Maps, and ESRI services. Being will be using the OSM basemap for this example:
L.tileLayer("http://a.tile.openstreetmap.org/{z}/{x}/{y}.png", {/*no properties*/
}).addTo(map);
  • Finally, let's add a marker, a basic functionality you will want in most maps. We can set the text inside "bindPopup" being able to format with html tags. "openPopup" function displays the pop up directly at start.
//marker object
var marker = L.marker([25.77, -80.13]).addTo(map);

//pop up object attached to marker object
marker.bindPopup("<b>I'm in</b><br>Miami Beach!").openPopup();

Final result.

The rectangle below is a HTML block with all the code above put together. It should which display a OSM basemap centered in Miami with a marker in Miami Beach.


The source code inside the HTML block above is exactly the following:

<!DOCTYPE html>
<html>

<head>
<meta http-equiv="Content-Type" content="text/html; charset=UTF-8">

<link rel="stylesheet" href="https://unpkg.com/[email protected]/dist/leaflet.css"
  integrity="sha512-xodZBNTC5n17Xt2atTPuE1HxjVMSvLVW9ocqUKLsCC5CXdbqCmblAshOMAS6/keqq/sMZMZ19scR4PsZChSR7A=="
  crossorigin=""/>
<script src="https://unpkg.com/[email protected]/dist/leaflet.js"
  integrity="sha512-XQoYMqMTK8LvdxXYG3nZ448hOEQiglfqkJs1NOQV44cWnUrBc8PkAOcXy20w0vlaXaVUearIOBhiXZ5V3ynxwA=="
  crossorigin=""></script>

</head>

<style>
#mapid{border-radius: 30px;}
</style>

<body>
	<div id="mapid" style="height:500px;"></div>
</body>

<script>

//leaflet map object
var map = L.map('mapid').setView([25.75, -80.2], 12);

//tiled basemap object
var googleMaps = L.tileLayer("http://a.tile.openstreetmap.org/{z}/{x}/{y}.png", {/*no properties*/
}).addTo(map);

//marker object
var marker = L.marker([25.77, -80.13]).addTo(map);

//pop up object attached to marker object
marker.bindPopup("<b>I'm in</b><br>Miami Beach!").openPopup();


</script>
</html>

TIP! You can copy paste this code in a text file with .html extension and preview locally in a browser.

Don't miss the Docs and Plugins sections in the Leaflet JS website. There are plenty of features that you can add to your map. The most interesting are:

I hope you enjoyed this introduction to Leaflet and you can make good use of it. Also, if you can, contribute in its development or spread its use!

You can keep reading a cool use of Leaflet in our article about Turf integration on Leaflet: web-based GIS operations come true.

References

Newer posts »