The usual way to see and work with these files is using a GIS software like QGIS or ArcGIS, but how can we make this friendly to standard users? Wouldn’t it be better seen directly in 3D and visit the place virtually?
At this point is where I found CesiumJS: a 3D map viewer styling [G] Earth but open-source, free and highly customizable to make your own projects.
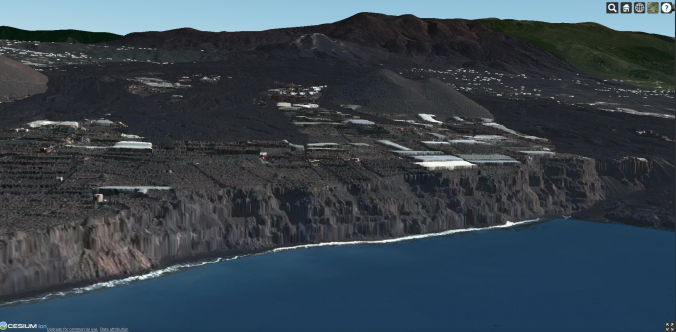
CesiumJS demo viewer of the new Tajogaite terrain with IDE Canarias satellite imagery. Click on the map to interact or open the full version.
Content
Create a Cesium ion account
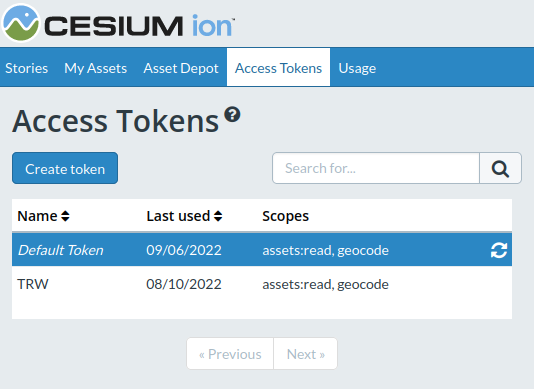
To use CesiumJS you need to register an account in order to obtain an Access Token.
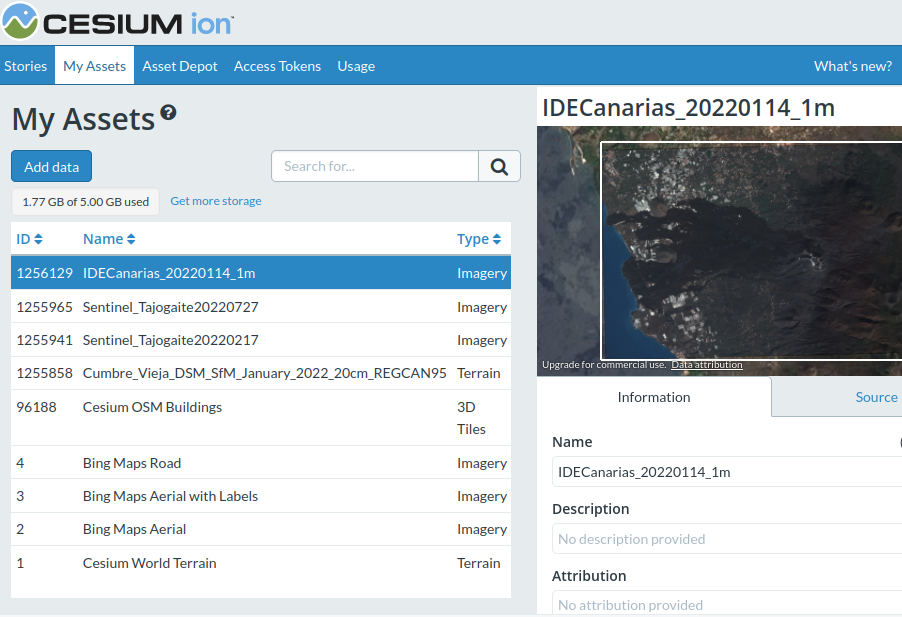
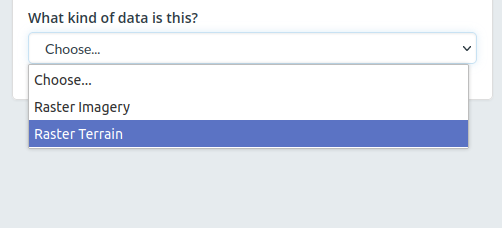
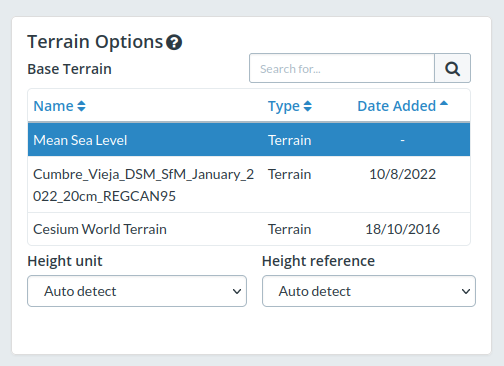
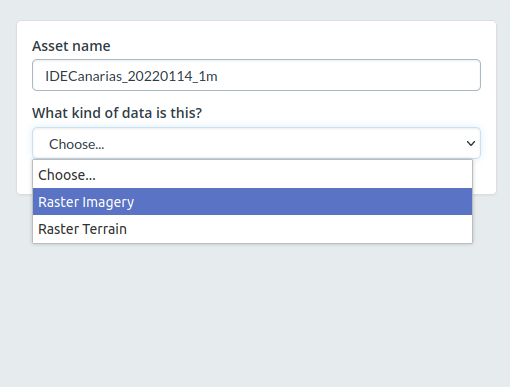
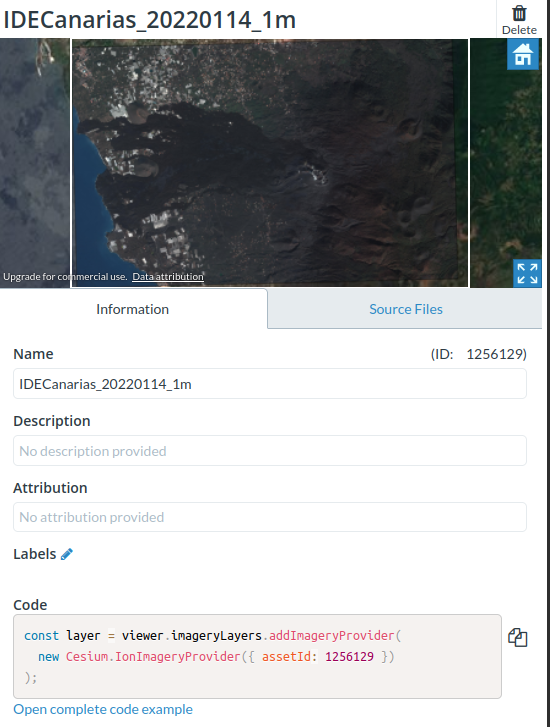
Registering, we can also upload our own files to customize our 3D map creations. In my case you can see that I uploaded the Digital Surface Model and imagery of the viewer. I drop the links in case you want to use the same files:
TIP! You can use the WMS service in your GIS software to extract the imagery, or download the one I use in this example (270 MB with 1m resolution)
Include CesiumJS in your web.
To use CesiumJS we configure a .html file as usual.
In this case, I'll copy the code directly from their quickstart example as it is only about 25 lines:
As you see, the main parts are:
links to CesiumJS libraries in the <head>
a <div> element with id "cesiumContainer" inside the <body>
the Access Token as variable Cesium.Ion.defaultAccessToken. Introduce yours here.
a "viewer" variable
the initial viewer configuration, specifying initial coordinates and X, Z angles.
<!DOCTYPE html>
<html lang="en">
<head>
  <meta charset="utf-8">
  <!-- Include the CesiumJS JavaScript and CSS files -->
  <script src="https://cesium.com/downloads/cesiumjs/releases/1.97/Build/Cesium/Cesium.js"></script>
  <link href="https://cesium.com/downloads/cesiumjs/releases/1.97/Build/Cesium/Widgets/widgets.css" rel="stylesheet">
</head>
<body>
  <div id="cesiumContainer"></div>
  <script>
    // Your access token can be found at: https://cesium.com/ion/tokens.
    // This is the default access token from your ion account
    Cesium.Ion.defaultAccessToken = 'eyJhbGciOiJIUzI1NiIsInR5cCI6IkpXVCJ9.eyJqdGkiOiI1MTYwNGM0Yi1iYzlkLTRkMTUtOGQyOS04YjQxNmUwZDQ0YjkiLCJpZCI6MTA0Mjc3LCJpYXQiOjE2NjAxMDk4MzR9.syNWeKPLWA2eMrEh4K9hvkyp1oGdbLMaL0Ozk1kaksk';
    // Initialize the Cesium Viewer in the HTML element with the `cesiumContainer` ID.
    const viewer = new Cesium.Viewer('cesiumContainer', {
      terrainProvider: Cesium.createWorldTerrain()
    });
    // Add Cesium OSM Buildings, a global 3D buildings layer.
    const buildingTileset = viewer.scene.primitives.add(Cesium.createOsmBuildings());
    // Fly the camera to San Francisco at the given longitude, latitude, and height.
    viewer.camera.flyTo({
      destination : Cesium.Cartesian3.fromDegrees(-122.4175, 37.655, 400),
      orientation : {
        heading : Cesium.Math.toRadians(0.0),
        pitch : Cesium.Math.toRadians(-15.0),
      }
    });
  </script>
 </div>
</body>
</html>
<html lang="en">
<head>
<meta charset="utf-8">
<script src="https://cesium.com/downloads/cesiumjs/releases/1.96/Build/Cesium/Cesium.js"></script>
<link href="https://cesium.com/downloads/cesiumjs/releases/1.96/Build/Cesium/Widgets/widgets.css" rel="stylesheet">
</head>
<body style="margin:0;width:100vw;height:100vh;">
<div style="height:100%;" id="cesiumContainer"></div>
<script>
// Your access token can be found at: https://cesium.com/ion/tokens.
// Replace `your_access_token` with your Cesium ion access token.
Cesium.Ion.defaultAccessToken = 'eyJhbGciOiJIUzI1NiIsInR5cCI6IkpXVCJ9.eyJqdGkiOiI1MTYwNGM0Yi1iYzlkLTRkMTUtOGQyOS04YjQxNmUwZDQ0YjkiLCJpZCI6MTA0Mjc3LCJpYXQiOjE2NjAxMDk4MzR9.syNWeKPLWA2eMrEh4K9hvkyp1oGdbLMaL0Ozk1kaksk';
// Initialize the Cesium Viewer in the HTML element with the `cesiumContainer` ID.
const viewer = new Cesium.Viewer('cesiumContainer', {
//terrainProvider: Cesium.createWorldTerrain()//terreno original
terrainProvider: new Cesium.CesiumTerrainProvider({//terreno modificado
url: Cesium.IonResource.fromAssetId(1255858),
}),
});
// Esconder widgest inferiores
viewer.timeline.container.style.visibility = "hidden";
viewer.animation.container.style.visibility = "hidden";
// Add Sentinel2 imagery
const layer = viewer.imageryLayers.addImageryProvider(
new Cesium.IonImageryProvider({ assetId: 1256129 })
);
// Add Cesium OSM Buildings, a global 3D buildings layer.
const buildingTileset = viewer.scene.primitives.add(Cesium.createOsmBuildings());
// Fly the camera to San Francisco at the given longitude, latitude, and height.
viewer.camera.flyTo({
    destination : Cesium.Cartesian3.fromDegrees(-17.8195, 28.6052, 3000),
    orientation : {
    heading : Cesium.Math.toRadians(-85.0),
    pitch : Cesium.Math.toRadians(-30.0),
    }
});
</script>
</div>
</html>
And that's it! You can create tons of immersive web apps with detailed terrains better than the standard ones.
Where else can you use CesiumJS? Tell it on Twitter 🐦