Today I’m sharing a very simple yet effective and elegant PS5 controller hanger.
Some concept/design images:
It just stands on its own without any screwing or glueing. It hangs from the PS5 itself and it’s expandable by design (probably you can fit up to 4 controllers just on one side).
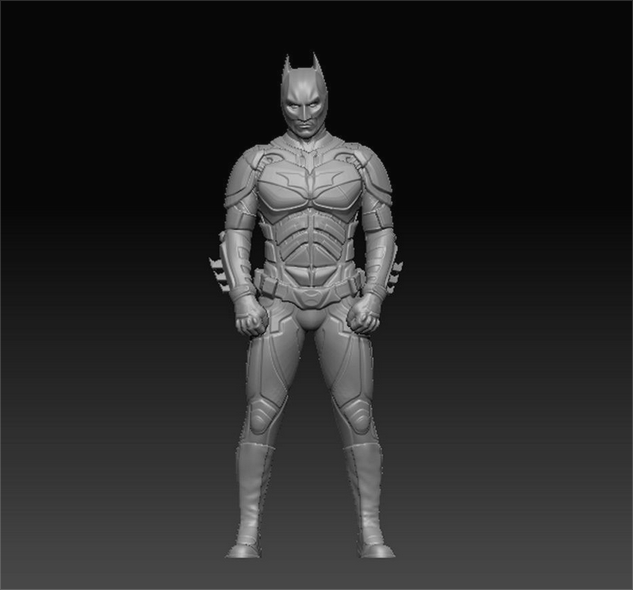
The truth is that resin printing is next level. Despite the complications of cleaning, the result is really incredible, and today I’m showing you my first print in the Anycubic Photon Mono X2: a Batman you can hang in your living-room with his grappling gun.
Content
Models
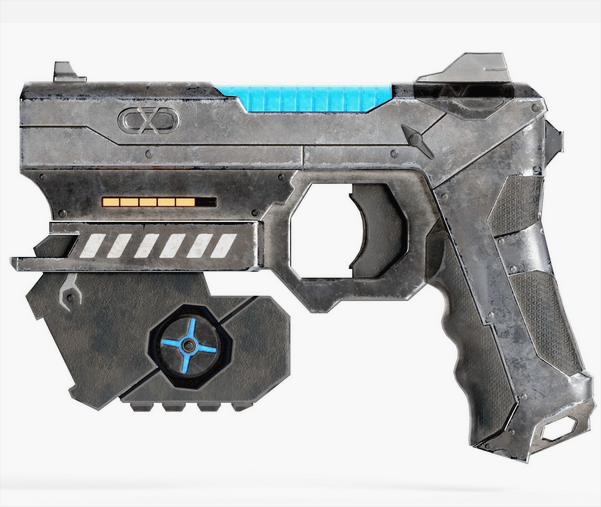
The print that you see is made of two free models. That's why here's a huge thank to the authors and my reference to their work:
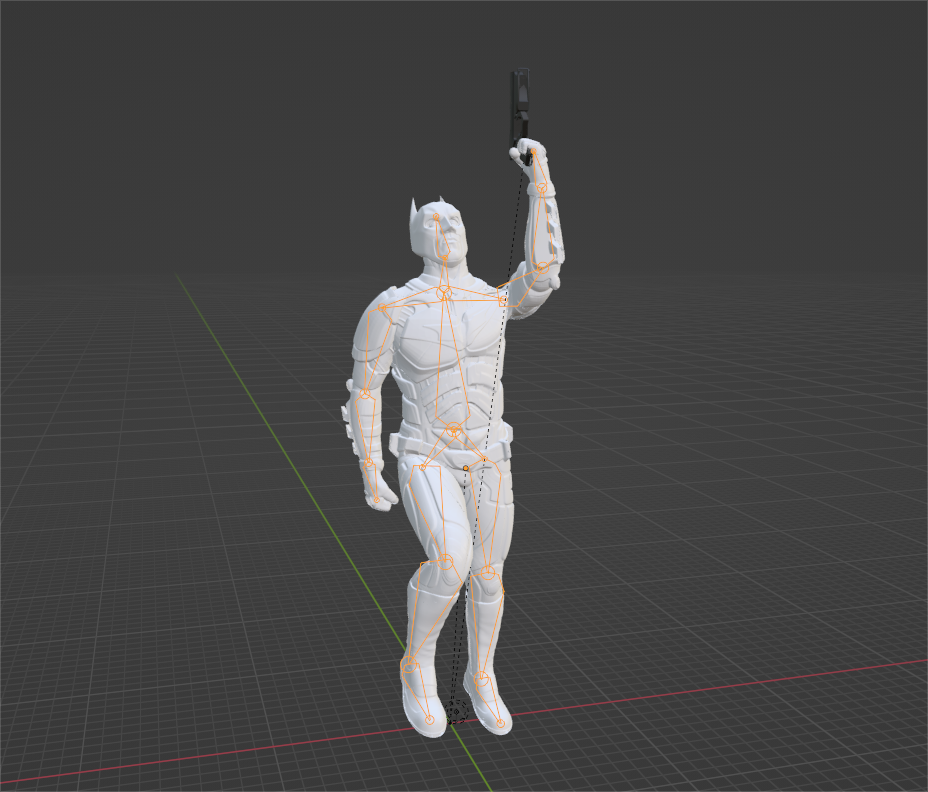
All I've done is to add an armature to the model giving it the desired pose, and then sticking the gun to its hand. So here is my model so you can print it just as shown.
To finish the figure, you can create a cape and a hook so it can be hanged.
Cape
For the cape I've cut out a piece of fabric from an old sportswear. This is common clothing that's usually black and with an adequate brightness and texture.
Start cutting a square piece and then give it some shape.
In the top part, wrap a wire that will let you adjust the cape around the figure's neck.
Hook
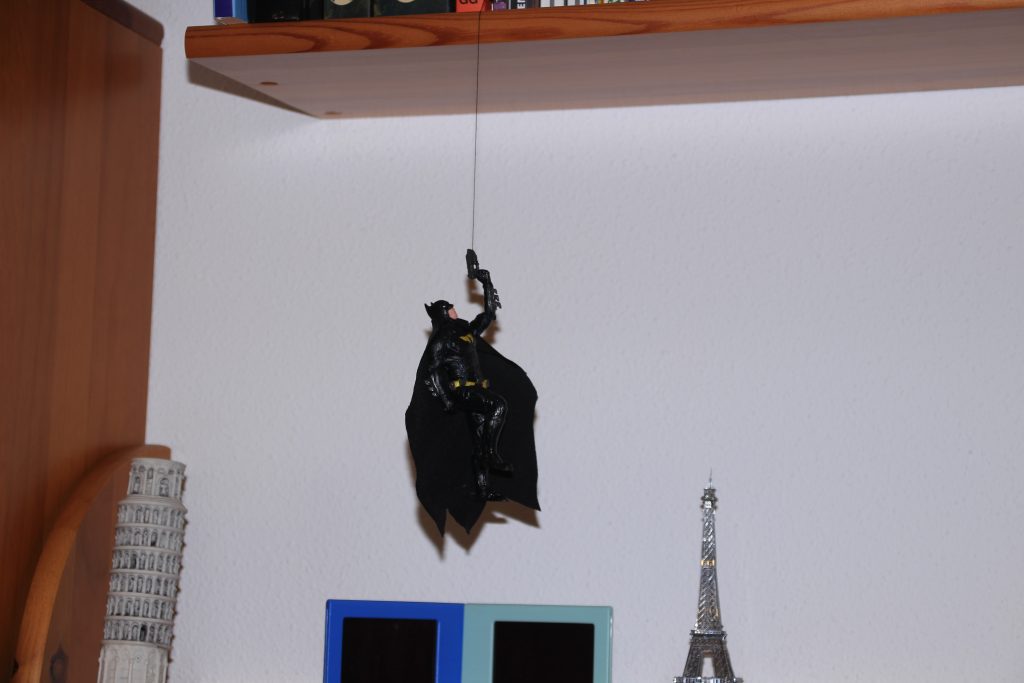
Just find some kind of hook or clamp that lets you tie a thin thread around it. I've used this small paper clamp that I can hook in the books of my shelf.
And that's how you get your awesome Batman hanging in your living-room. Hope you liked it, and any ideas or comments, drop them on Twitter!
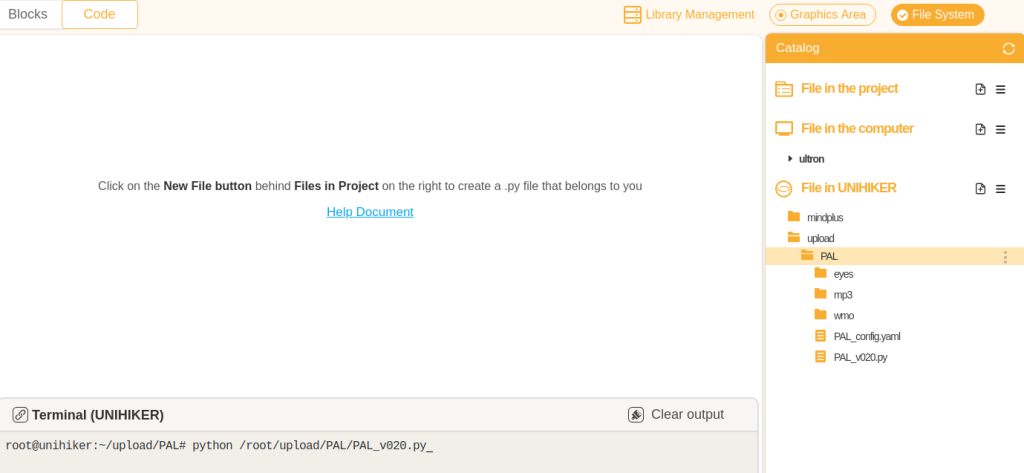
PAL is a simplified version of my python home assistant that I’m running in the DFRobot UNIHIKER which I’m releasing as free open-source.
This is just a demonstration for voice-recognition command-triggering simplicity using python and hopefully will serve as a guide for your own assistant.
Current version: v0.2.0(updated september 2024)
Content
Features
Current version includes the following:
Voice recognition: using open-source SpeechRecognition python library, returns an array of all the recognised audio strings.
Weather forecast: using World Meteorological Organization API data, provides today's weather and the forecast for the 3 coming days. Includes WMO weather icons.
Local temperature: reads local BMP-280 temperature sensor to provide a room temperature indicator.
IoT HTTP commands: basic workflow to control IoT smart home devices using HTTP commands. Currently turns ON and OFF a Shelly2.5 smart switch.
Power-save mode: controls brightness to lower power consumption.
Connection manager: regularly checks wifi and pings to the internet to restore connection when it's lost.
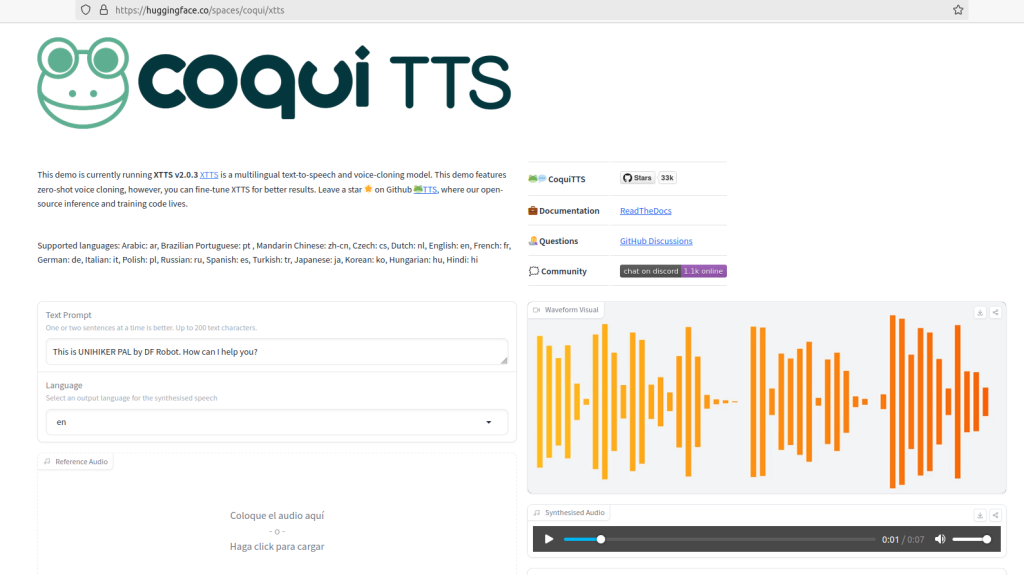
PAL voice samples: cloned voice of PAL from "The Mitchells vs. The Machines" using the AI voice model CoquiAI-TTS v2.
UNIHIKER buttons: button A enables a simple menu (this is thought to enable a more complex menu in the future).
Touchscreen controls: restore brightness (center), switch program (left) and close program (right), when touching different areas of the screen.
At the moment, PAL v0.2.0 only includes functionality for Shelly2.5 for demonstration purposes.
Use variables lampBrand, lampChannel and lampIP to suit your Shelly2.5 configuration.
This is just as an example to show how different devices could be configured. These variables should be used to change the particularities of the HTTP command that is sent to different IoT devices.
More devices will be added in future releases, like Shelly1, ShellyDimmer, Sonoff D1, etc.
Power save mode
Power saving reduces the brightness of the device in order to reduce the power consumption of the UNIHIKER. This is done using the system command "brightness".
Change "ps_mode" variable to enable ("1") or disable ("0") the power-save mode.
Room temperature
Change "room_temp" variable to enable ("1") or disable ("0") the local temperature reading module. This requires a BMP-280 sensor to be installed using the I2C connector.
Check this other post for details on sensor installation:
Some theme configuration has been enabled by allowing to choose between different eyes as a background image.
Use the variables "eyesA" and "eyesB" specify one of the following values to change the background image expression of PAL:
"happy"
"angry"
"surprised"
"sad"
"happy""angry""surprised""sad"
"eyesA" is used as the default background and "eyesB" will be used as a transition when voice recognition is activated and PAL is talking.
The default value for "eyesA" is "surprised" and it will change to "happy" when a command is recognized.
Customizable commands
Adding your own commands to PAL is simple using the "comandos" function.
Every audio recognized by SpeechRecognition is sent as a string to the "comandos" function, which then filters the content and triggers one or another matching command.
Just define all the possible strings that could be recognized to trigger your command (note that sometimes SpeechRecognition provides wrong or inaccurate transcriptions).
Then define the command that is triggered if the string is matched.
def comandos(msg):
    # LAMP ON
    if any(keyword in msg for keyword in ["turn on the lamp", "turn the lights on","turn the light on", "turn on the light", "turn on the lights"]):
        turnLAMP("on")
        os.system("aplay '/root/upload/PAL/mp3/Turn_ON_lights.wav'")
Activation keyword
You can customize the keywords or strings that will activate command functions. If any of the keywords in the list is recognized, the whole sentence is sent to the "comandos" function to find any specific command to be triggered.
For the case of PAL v0.2, these are the keywords that activate it (90% it's Paypal):
You can change this to any other sentence or name, so PAL is activated when you call it by these strings.
PAL voice
Use the sample audio file "PAL_full" below (also in the github repo in /mp3) as a reference audio for CoquiAI-TTS v2 voice cloning and produce your personalized voices:
Below are a few examples of queries and replies from PAL:
"Hey PAL, turn on the lights!""Hey PAL, turn the lights off"
Future releases (To-Do list)
I will be developing these features in my personal assistant, and will be updating the open-source release every now and then. Get in touch via github if you have special interest in any of them:
Advanced menu: allow configuration and manually triggering commands.
IoT devices: include all Shelly and Sonoff HTTP API commands.
Time query: requires cloning all number combinations...
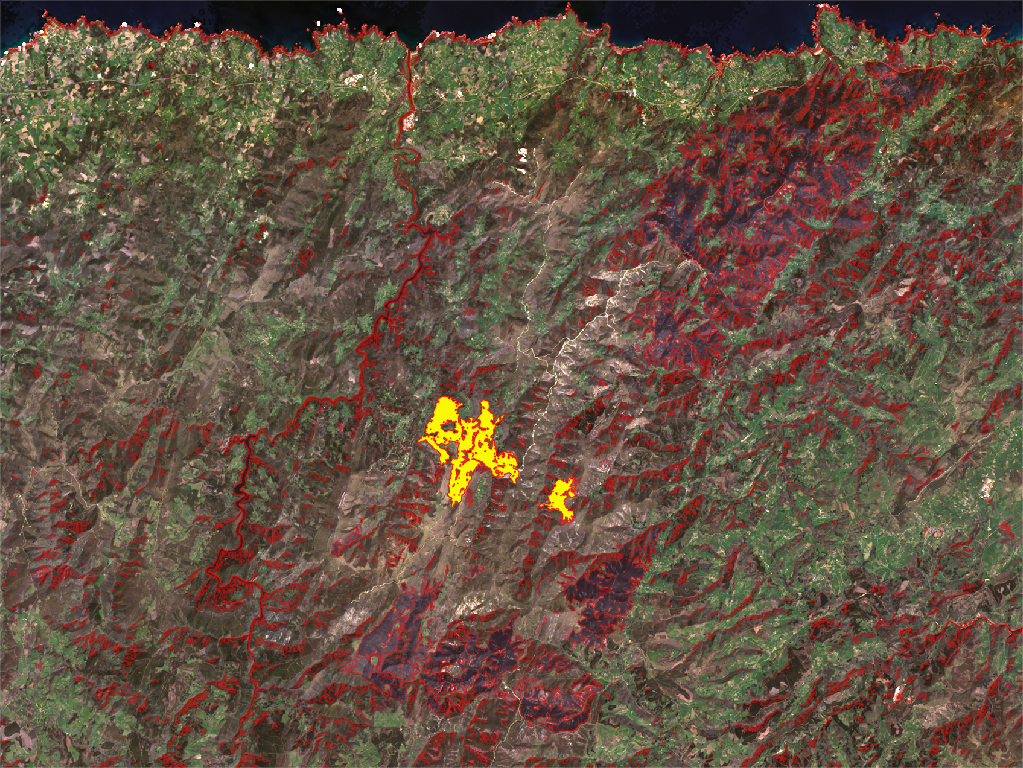
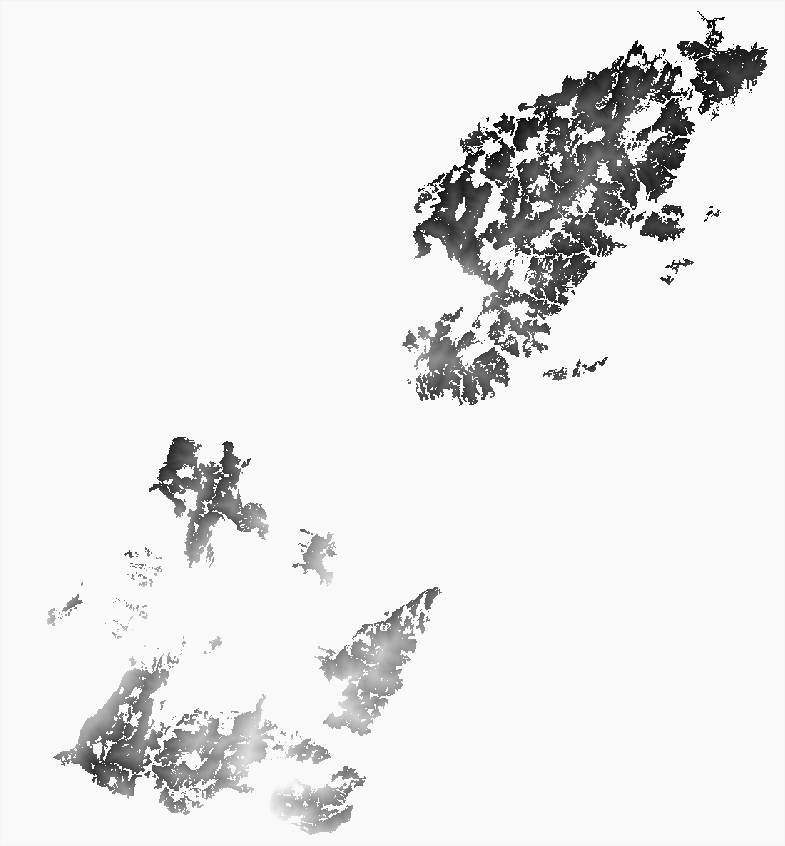
After a few posts about the use of satellite information, let’s see how to bring it (almost) all together in a practical and impacting example. And it’s given the latest wildfires occurred in Spain that they’ve called my attention as I could not imagine how brutal they have been (although nothing compared to the ones in Chile, Australia or USA). But let’s do the exercise without spending too much GB in geographical information.
What I want is to show the extent of the fire occurred in Asturias in March, but also to show the impact removing the trees affected by the flames. Let’s do it!
Content
Download data
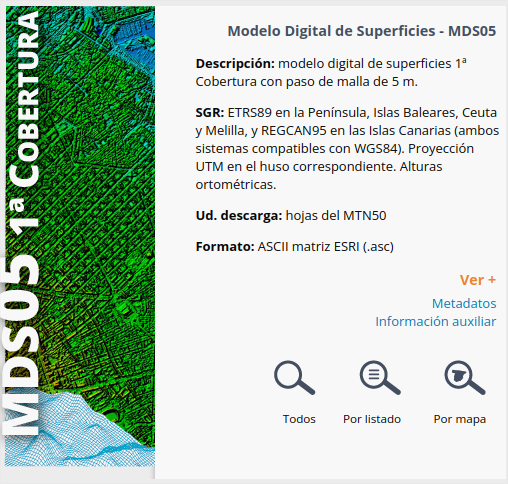
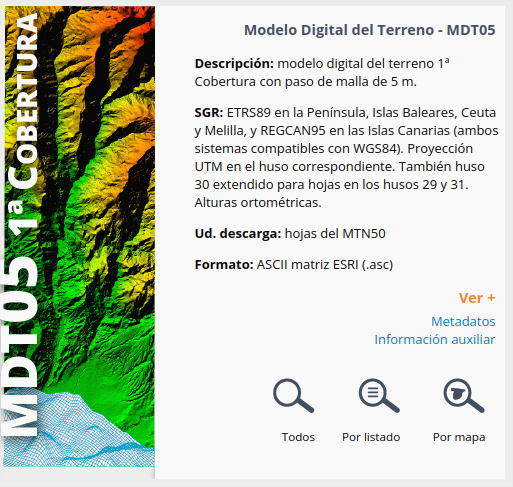
I will need a Digital Surface Model (which includes trees and structures), an orthophoto taken during the fire, and a Digital Terrain Model (which has been taken away trees and structures) to replace the areas affected by the fire.
1. Terrain models
I'm going to use the great models from Spanish IGN, downloading the products MDS5 and MDT5 for the area.
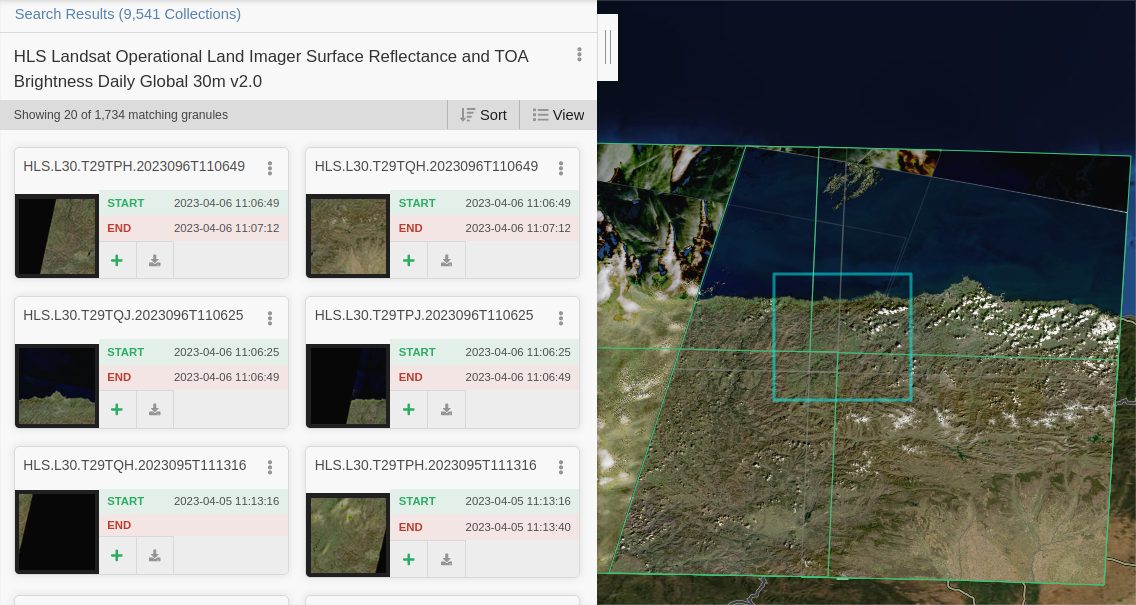
We'll use the process i.group from GRASS in QGIS to group the different bands captured by the satellite in a single RGB raster, as we saw in this previous post:
You'll have to do it for every region downloaded, four in my case, that will be joint later using Build virtual raster
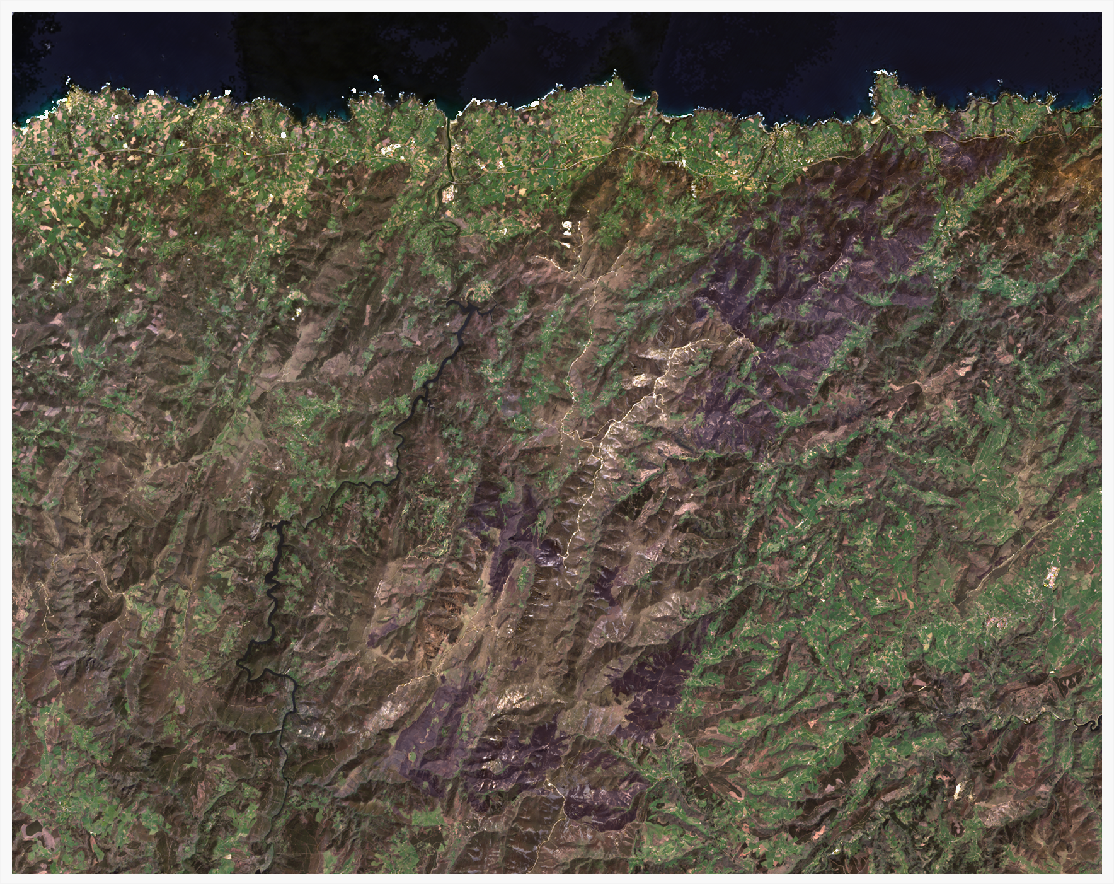
1. True color image (TCI)
Combine bands 4, 3, 2.
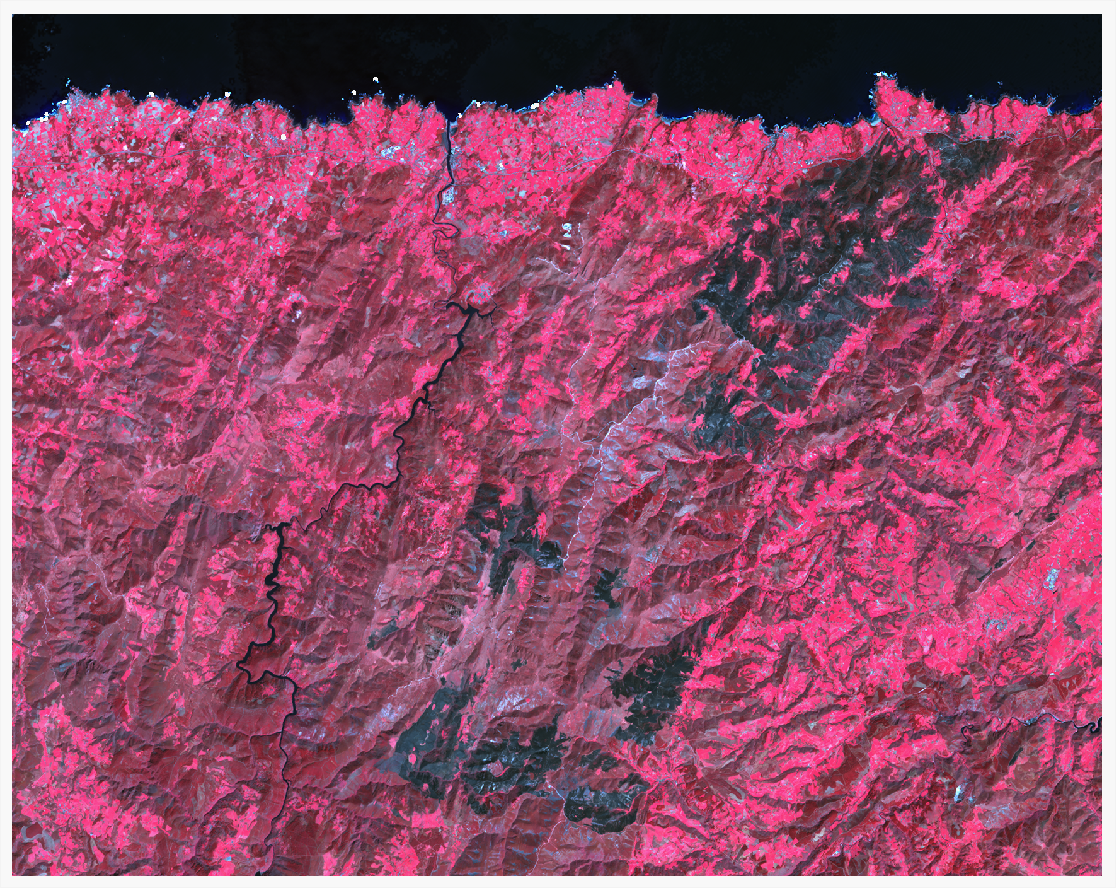
2. False color image
Combine bands 5, 4, 3.
3. Color adjustment
To get a better result, you can adjust the minimum and maximum values considered in each band composing the image. These values are found in the Histogram inside the layer properties.
here you have the values I used for the pictures above::
Band
TCI min
TCI max
FC min
FC max
1 Red
-100
1500
-50
4000
2 Green
0
1500
-100
2000
3 Blue
-10
1200
0
1200
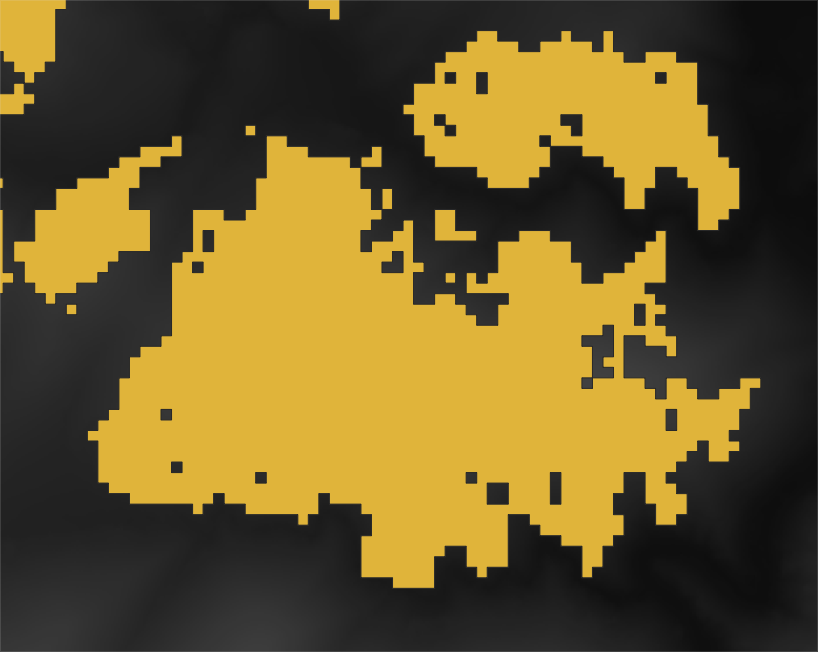
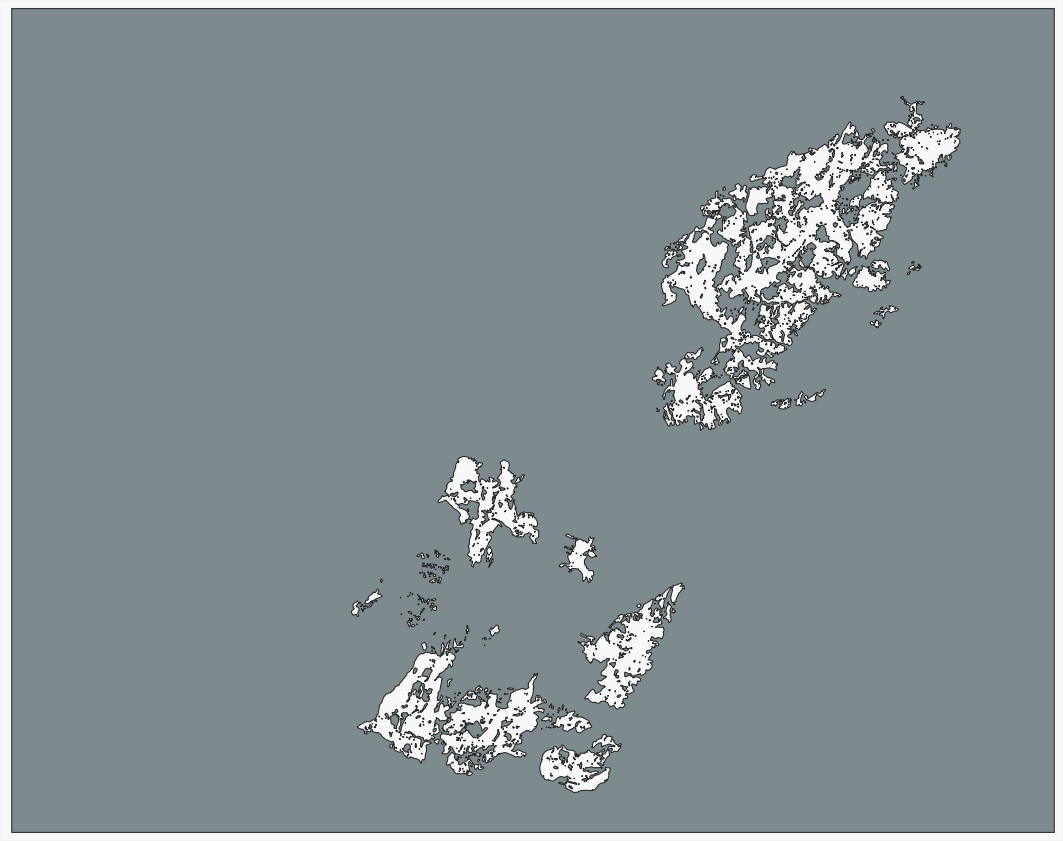
Fire extent
As you can see, the false color image shows a clear extension of the fire. We'll generate a polygon covering the extent of the fire with it.
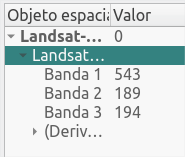
First, let's query the values in Band 1 (red) which offers a good contrast for values in the area of the fire. They are in the range 300-1300.
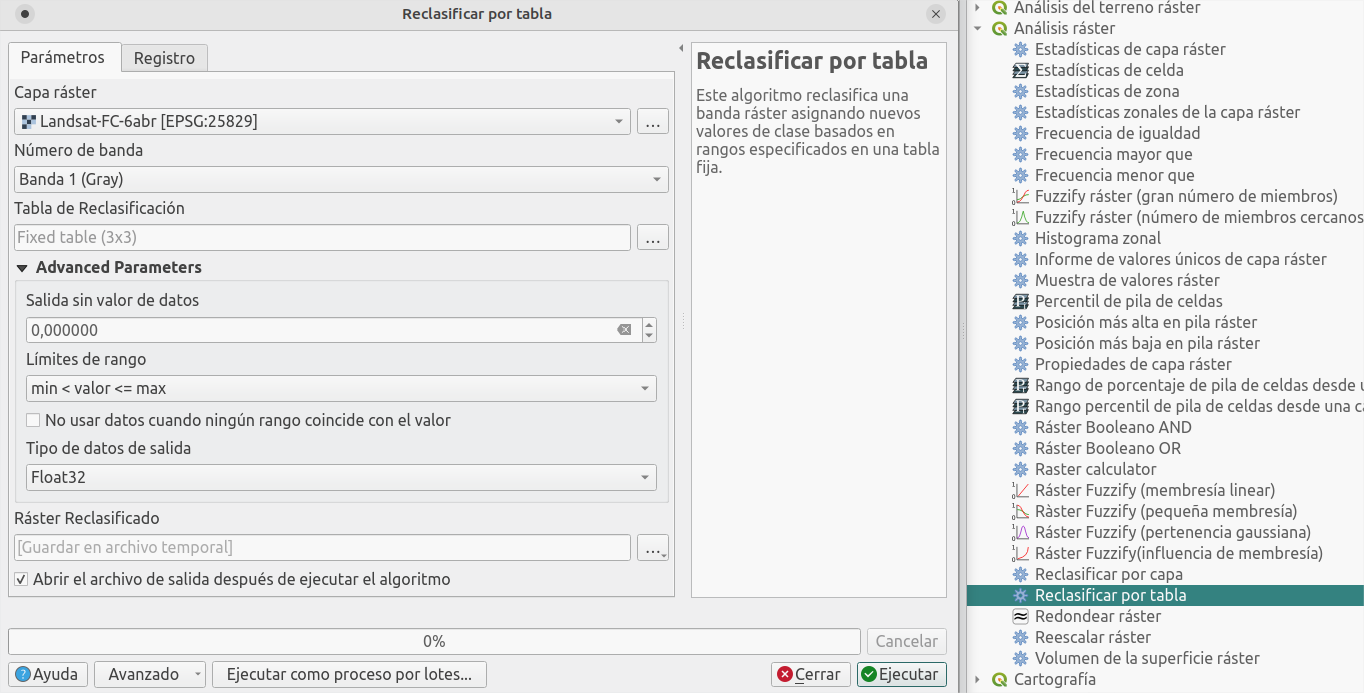
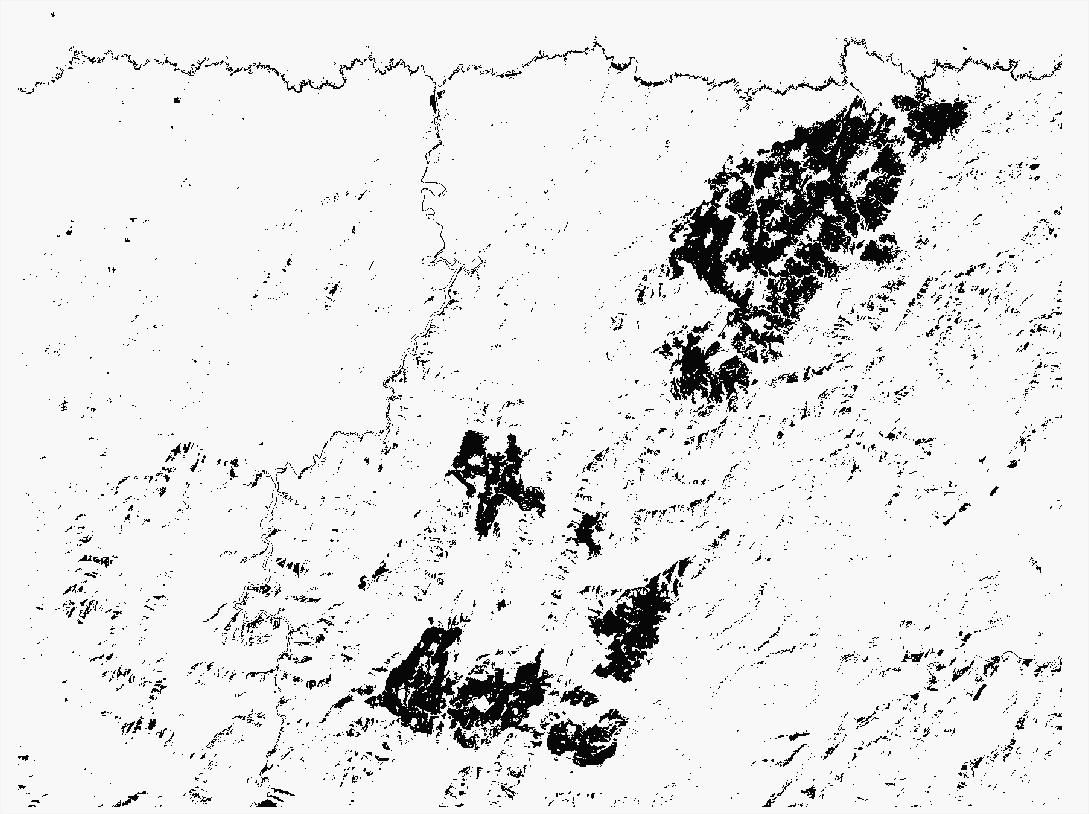
Using the process Reclassify by table, we'll assign value 1 to the cells inside this range, and value 0 to the rest.
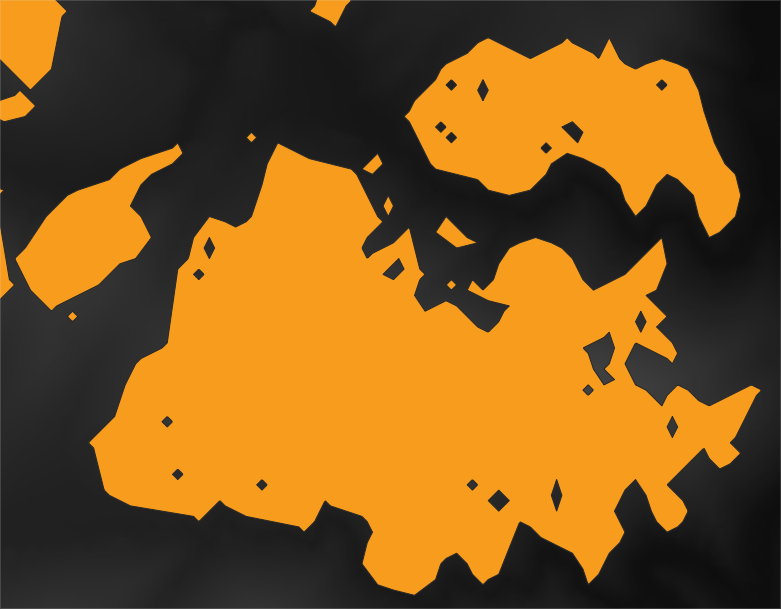
Vectorize the result with process Poligonize and, following the satellite imagery, select those polygons in the fire area.
Use the tool Dissolve to merge all the polygons in one element; then Smooth to round the corners slightly.
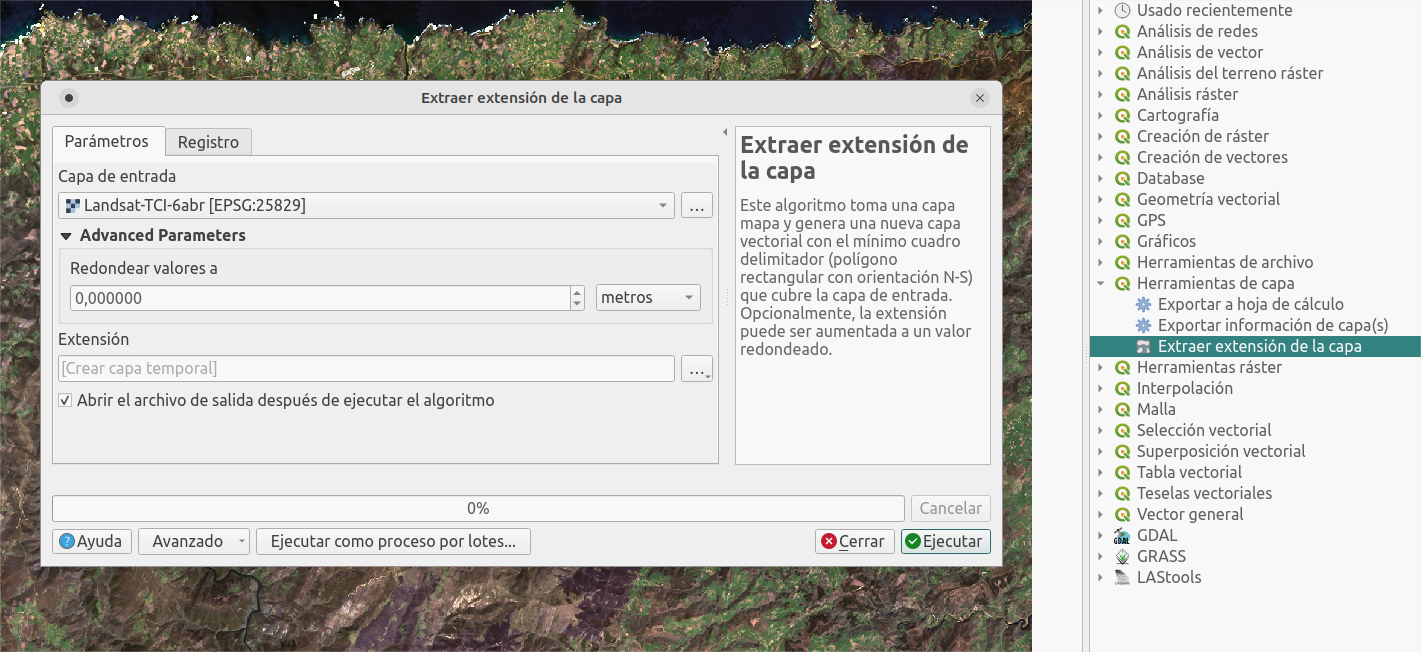
Let's now get the inverse. Extract by extent using the Landsat layer, then use Difference with the fire polygon.
Process terrain
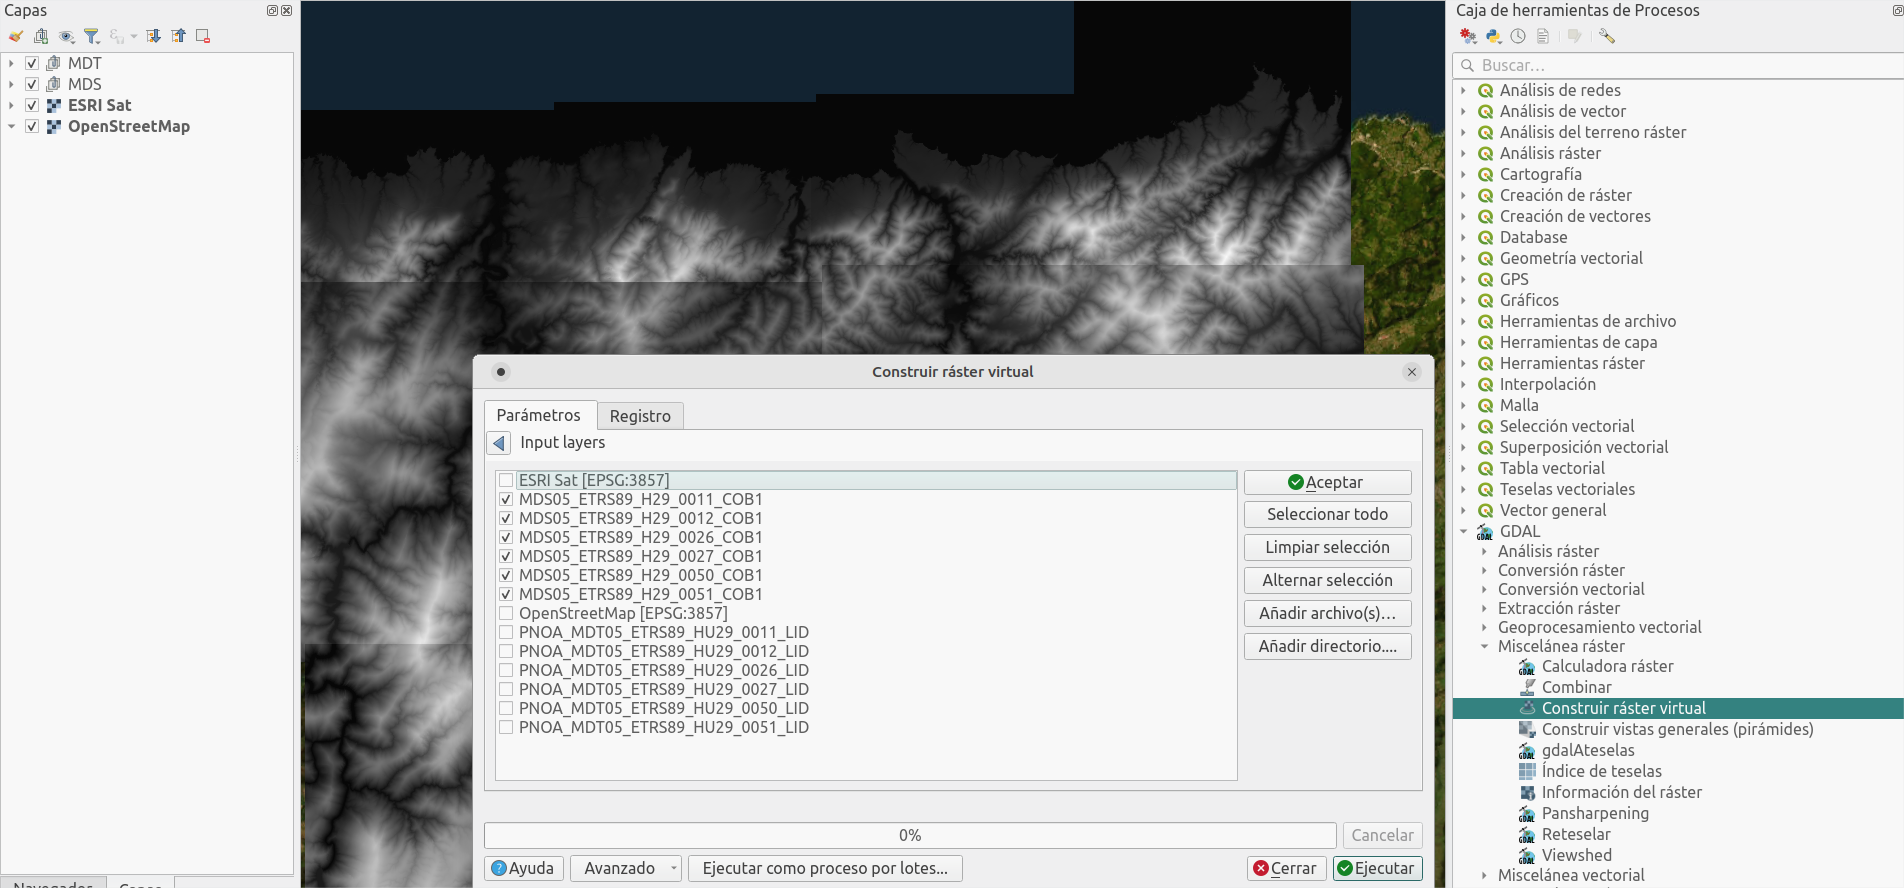
1. Combine terrain data
Join the same type model files in one (one for the DSM, and another one for the DTM). Use process Build virtual raster
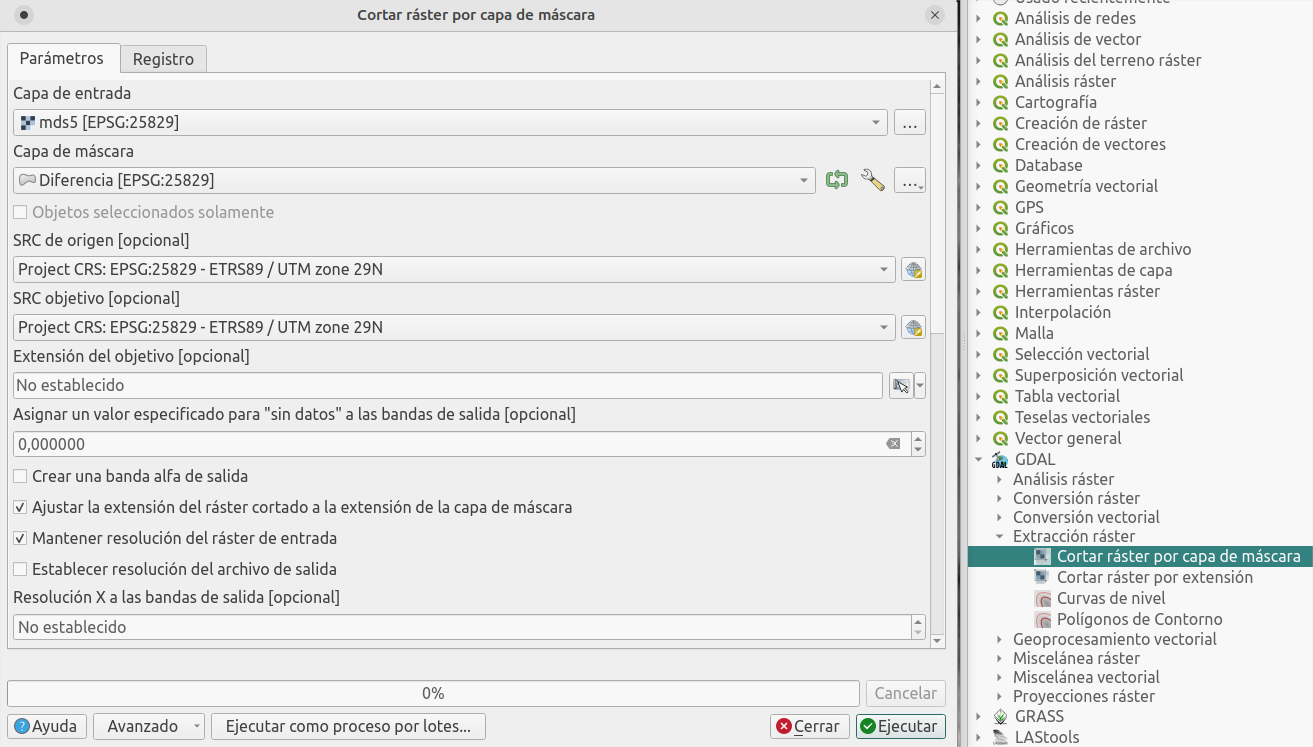
2. Extract terrain data
Extract the data of interest in each model:
From the DSM extract the surface affected by the fire, so you'll remove all the surface in it.
Do the opposite with the DTM: keep the terrain (without trees) in the fire area, so it will fill the gaps in the other model.
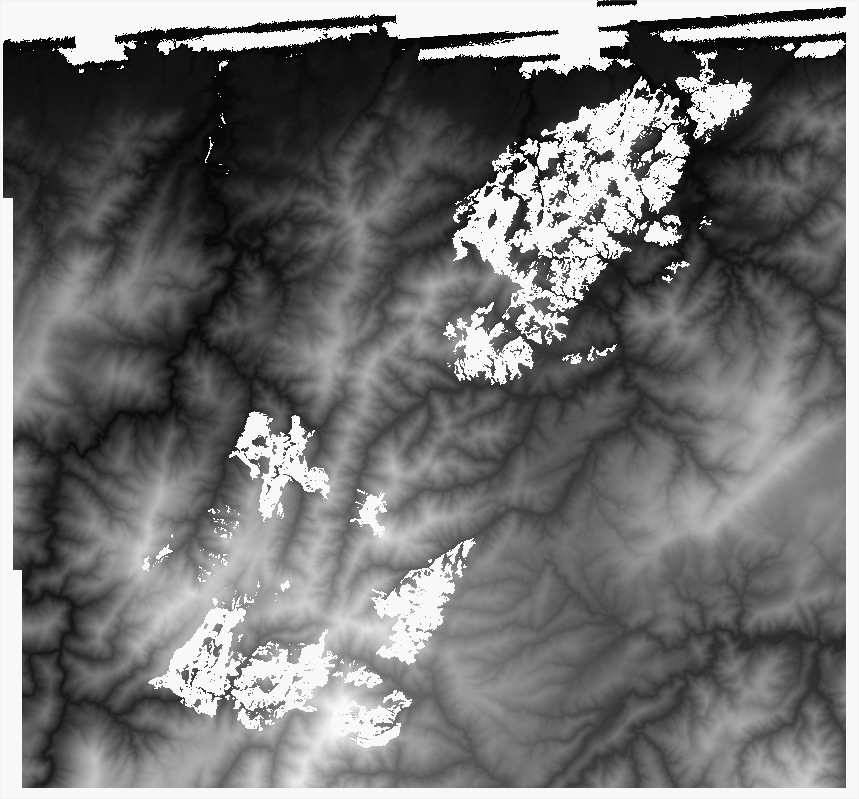
Use the process Crop raster by mask layer using the layers generated previously.
Finally join both raster layers, so they fill each others' gaps, using Build virtual raster.
Bring it to life with Cesium JS
You should already have a surface model without trees in the fire area, but let's try to explore it in an interactive way.
I showed a similar example, using a custom Digital Terrain Model, as well as a recent satellite image, for the Tajogaite volcano in La Palma:
In this case I'll use Cesium JS again to interact easily with the map (follow the post linked above to see how to upload your custom files to the Cesium JS viewer).
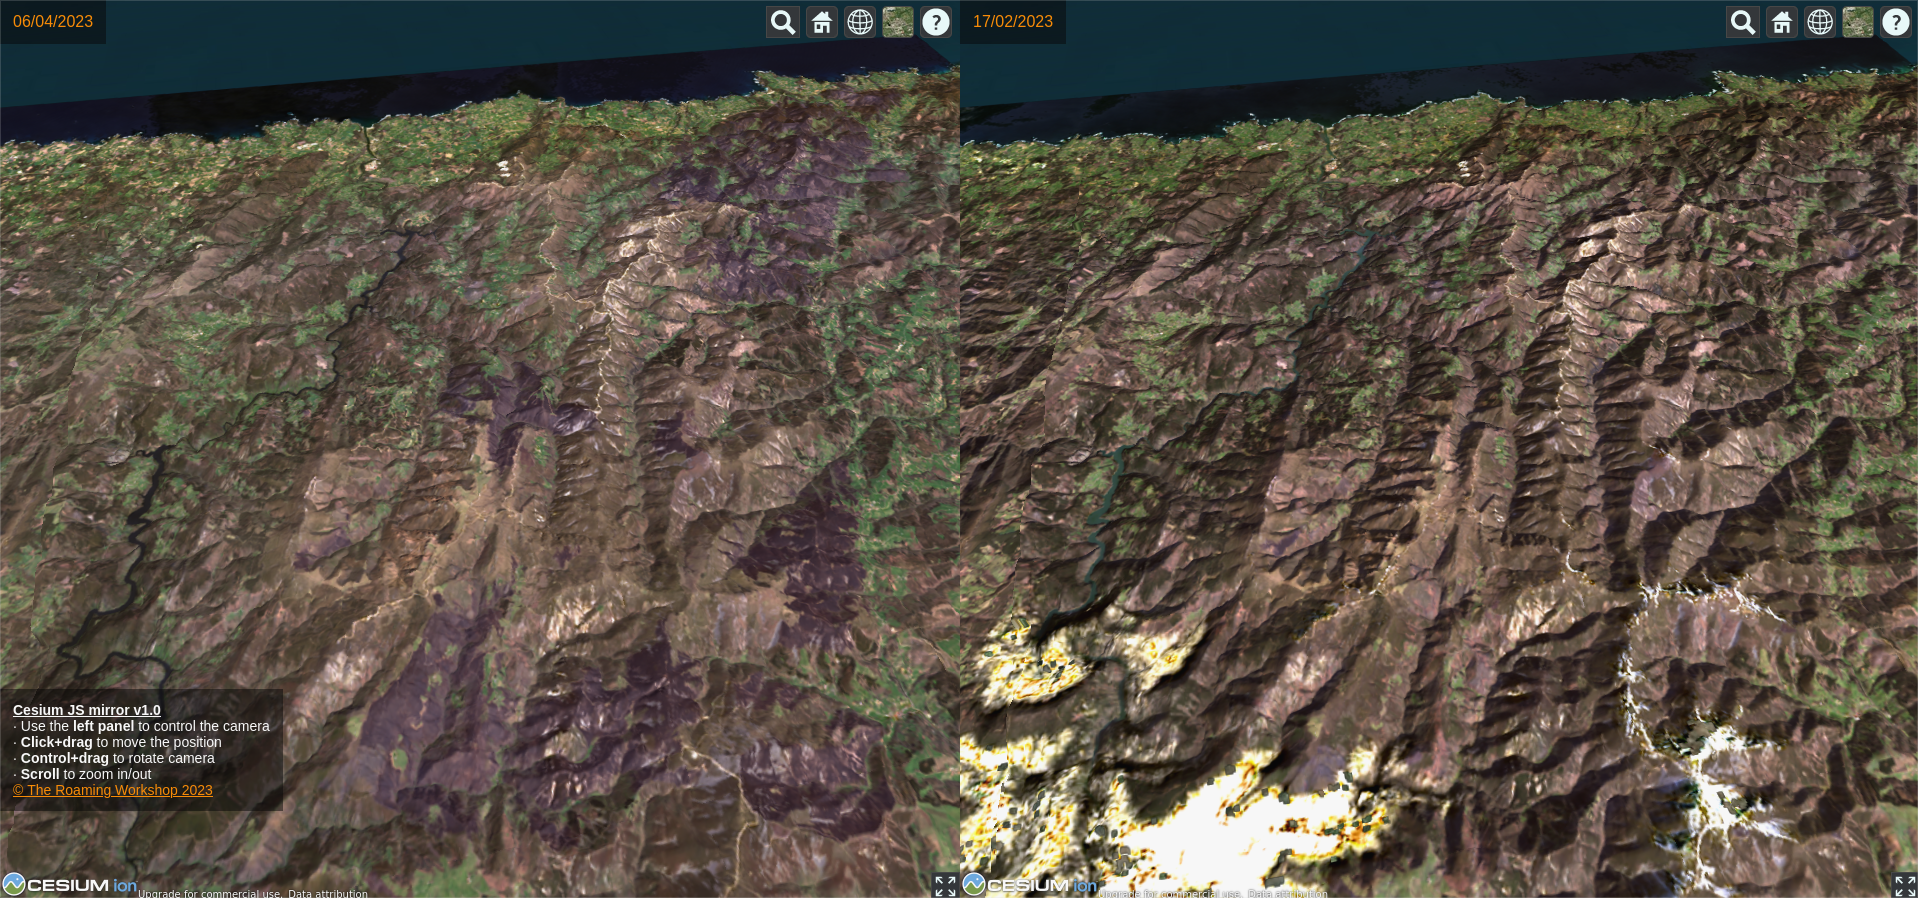
For this purpose, I created a split-screen viewer (using two separate instances of Cesium JS) to show the before and after picture of the fire. Here you have a preview:
I hope you liked it! here you have the full code and a link to github, where you can download it directly. And remember, share your doubts or comments on twitter!
I was writing a post where I wanted to insert a 3D model to picture it better, and I even thought in doing a viewer myself. But I didn’t have to browse long to find Three.js.
Let's keep with the example and fill up the second <script> block defining a scene with an animated rotating cube:
<script type="module">
        import * as THREE from 'three';
	const scene = new THREE.Scene();
	const camera = new THREE.PerspectiveCamera( 75, window.innerWidth / window.innerHeight, 0.1, 1000 );

	const renderer = new THREE.WebGLRenderer();
	renderer.setSize( window.innerWidth, window.innerHeight );
	document.body.appendChild( renderer.domElement );

	const geometry = new THREE.BoxGeometry( 1, 1, 1 );
	const material = new THREE.MeshBasicMaterial( { color: 0x00ff00 } );
	const cube = new THREE.Mesh( geometry, material );
	scene.add( cube );

	camera.position.z = 5;

	function animate() {
		requestAnimationFrame( animate );

		cube.rotation.x += 0.01;
		cube.rotation.y += 0.01;

		renderer.render( scene, camera );
	};

	animate();
</script>
All of this would look like this:
Add drag controls and background
Now we have a base to work with. We can add some functionality inserting the OrbitControls module.
//Import new modules at the beginning of the script
import { OrbitControls } from 'https://unpkg.com/[email protected]/examples/jsm/controls/OrbitControls.js';

//then add the mouse controls after declaring the camera and renderer
const controls = new OrbitControls( camera, renderer.domElement );
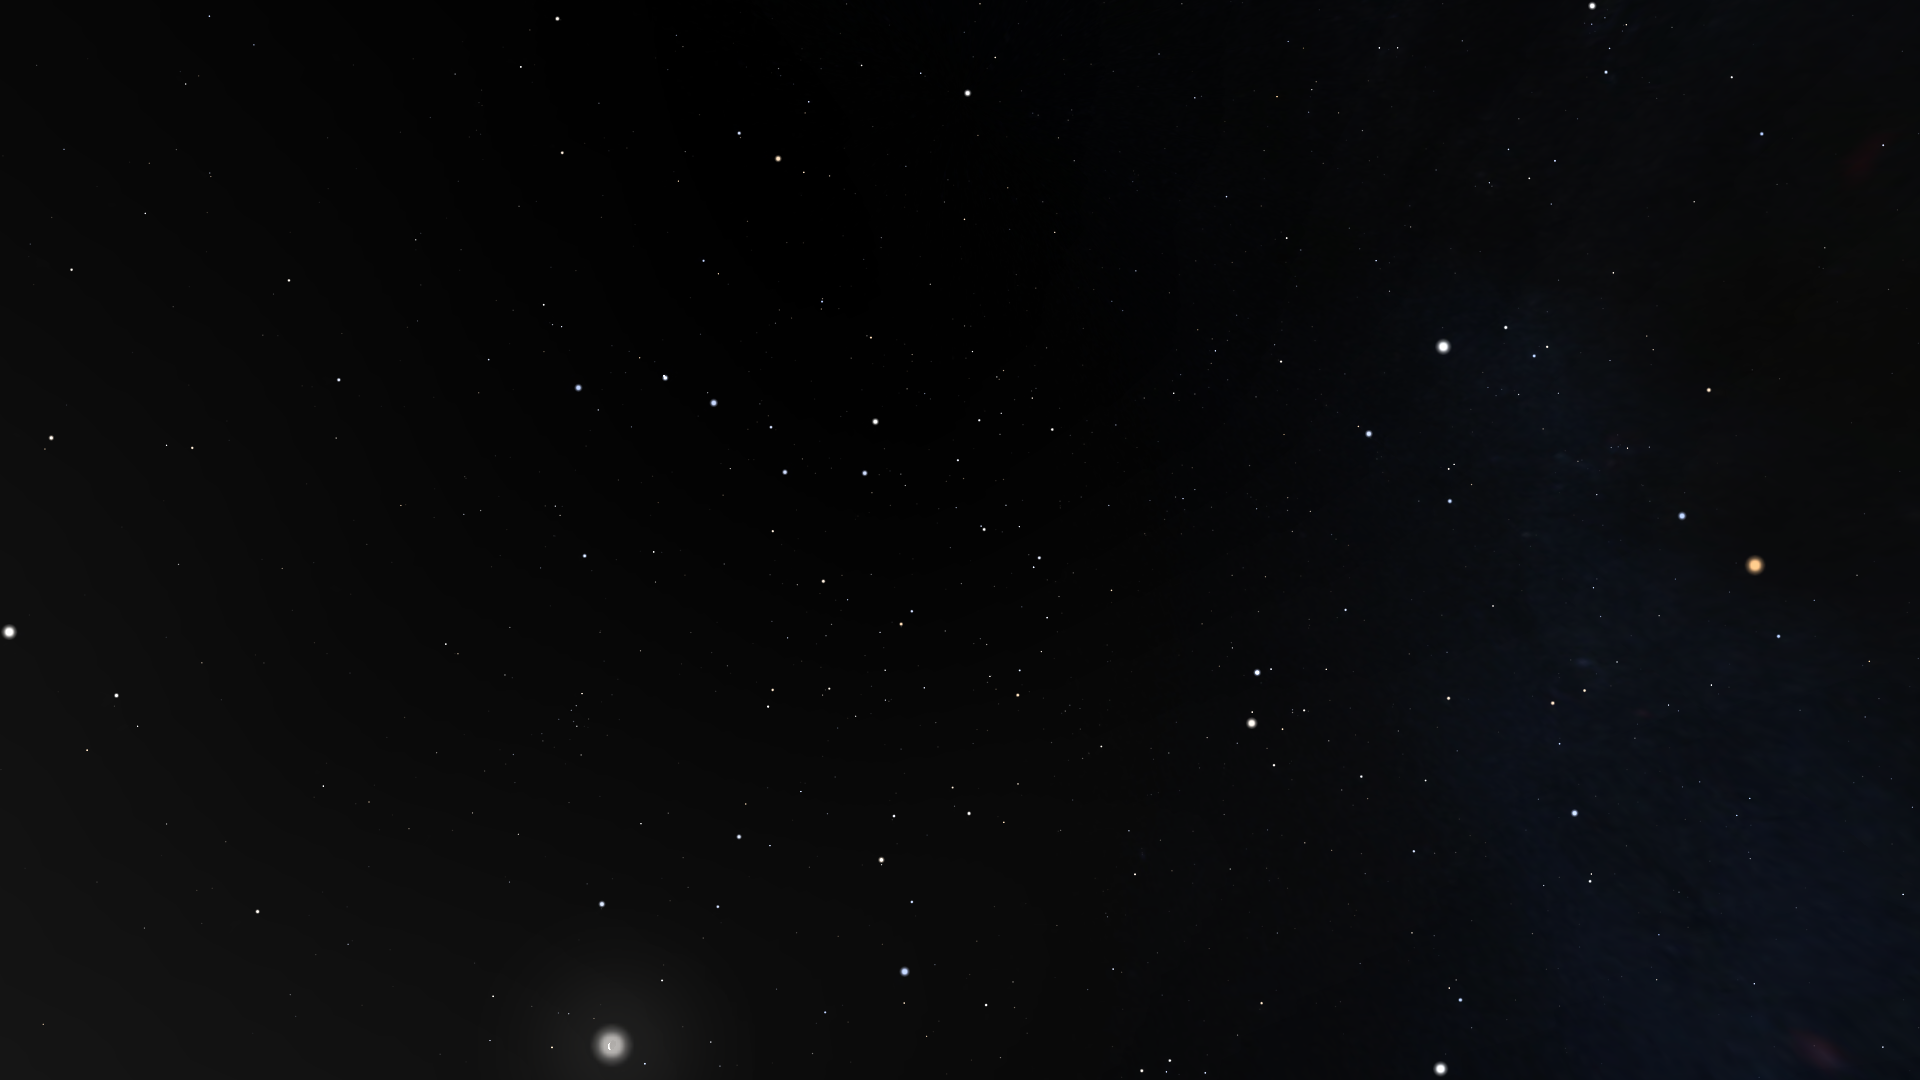
Also, you can modify the background easily, but you will need to host your images within your app in a server, or run it locally, because of CORS. I will be using the background image of the blog header, which was taken from Stellarium.
First define a texture. Then, add it to the scene:
//do this before rendering, while defining the scene
//define texture
const texture = new THREE.TextureLoader().load( "https://theroamingworkshop.cloud/demos/Unity1-north.png" );

//add texture to scene
scene.background=texture;
Full code:
<!DOCTYPE html>
<html>
	<head>
		<meta charset="utf-8">
		<title>My first three.js app</title>
		<style>
			body { margin: 0; }
		</style>
	</head>
	<body>
        <script async src="https://unpkg.com/[email protected]/dist/es-module-shims.js"></script>

        <script type="importmap">
          {
            "imports": {
              "three": "https://unpkg.com/[email protected]/build/three.module.js"
            }
          }
        </script>
<body style="margin: 0; width:100%;height:300px;">
        <script async src="https://unpkg.com/[email protected]/dist/es-module-shims.js"></script>

        <script type="importmap">
          {
            "imports": {
              "three": "https://unpkg.com/[email protected]/build/three.module.js"
            }
          }
        </script>

    <script type="module">

    import * as THREE from 'three';
	import { OrbitControls } from 'https://unpkg.com/[email protected]/examples/jsm/controls/OrbitControls.js';

	const scene = new THREE.Scene();

	const texture = new THREE.TextureLoader().load( "https://theroamingworkshop.cloud/demos/Unity1-north.png" );
	scene.background=texture;

    const camera = new THREE.PerspectiveCamera( 75, window.innerWidth / window.innerHeight, 0.1, 1000 );

	const renderer = new THREE.WebGLRenderer();
	renderer.setSize( window.innerWidth, window.innerHeight );
	document.body.appendChild( renderer.domElement );

    const controls = new OrbitControls( camera, renderer.domElement );

	const geometry = new THREE.BoxGeometry( 1, 1, 1 );
	const material = new THREE.MeshBasicMaterial( { color: 0x00ff00 } );
	const cube = new THREE.Mesh( geometry, material );
	scene.add( cube );

	camera.position.z = 5;

	function animate() {
		requestAnimationFrame( animate );

		cube.rotation.x += 0.01;
		cube.rotation.y += 0.01;

		renderer.render( scene, camera );
	};

	animate();
</script>
</body>
</html>
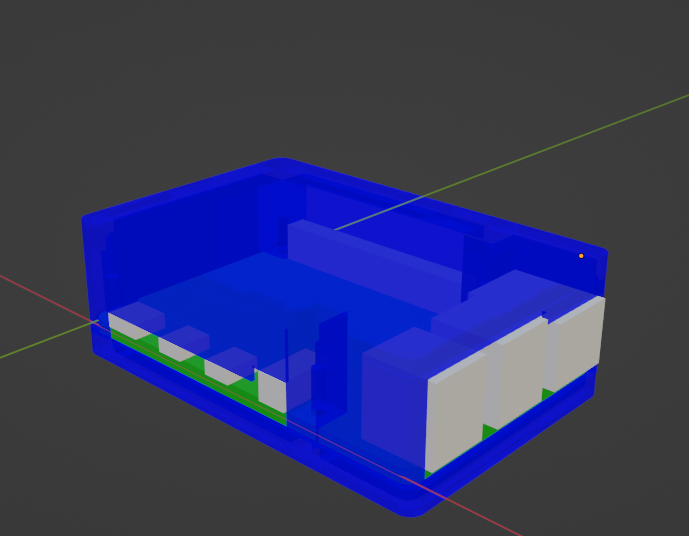
Insert a 3D model
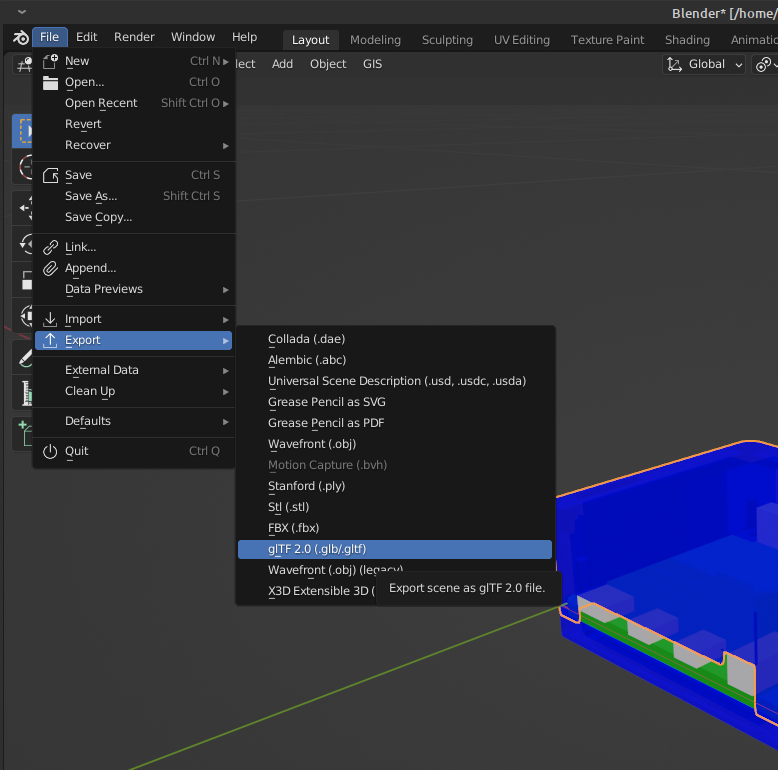
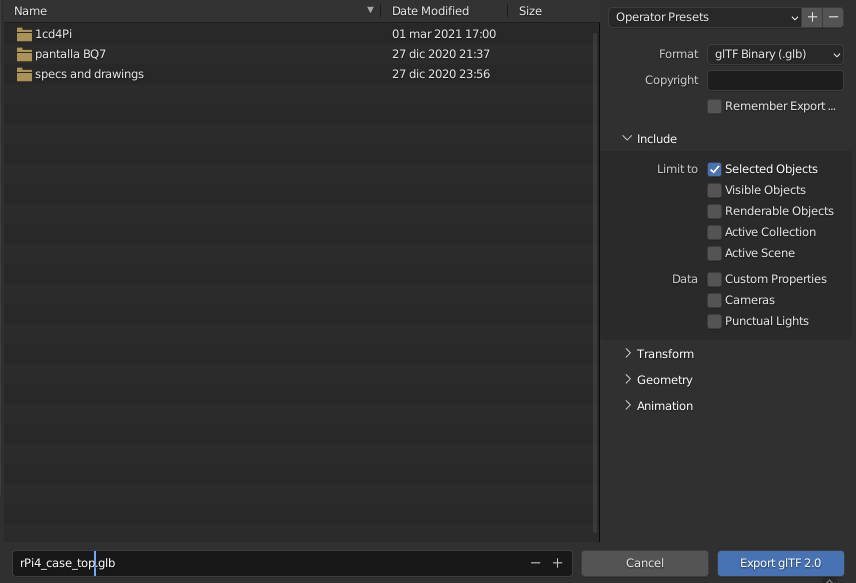
Now let's replace the cube for our own 3D model which, in the case of Three.js, will be a glTF (.GLB o .GLTF) format, that is most supported and renders faster (.fbx, .stl, .obj and so on are also supported).
I will export a .glb of this basic Raspberry Pi 4B case that I did some time ago using Blender:
Now, replace the <script> block based on the "webgl_loader_gltf" which was shown at the start of the post:
UPDATE 2023! Hourly WMS service removed and daily version updated to V2. WMS version updated to 1.3.0
Recently it’s been trendy to talk about the increased warming of the Sea, and I’ve found very few maps where you can actually click and check the temperature it pretends to indicate.
So I’ve done my own:
I’m going to find a WMS with the required raster information,
Replicate the legend using html <canvas> elements,
And obtain the temperature value matching the pixel color value.
Content
The data
There are several and confusing information sources:
Puertos del Estado: My first attempt was to check the Spanish State Ports website, but the only good thing I found was that they use Leaflet.. They have a decent real-time viewer, but it's really complicated to access the data to do something with them (although I'll show you how in the future).
Copernicus: "Copernicus is the European Union's Earth observation programme", as they indicate in their website, and they gather the majority of geographical and environmental information produced in the EU member countries. In their marine section we'll find Sea Surface Temperature (SST) data obtained from satellite imagery and other instruments from different euopean organisms.
Global Ocean OSTIA Diurnal Skin Sea Surface Temperature
After trying them all, the most complete is the global map produced by the MetOffice.
As they indicate, it shows the hourly average in a gap-free map that uses in-situ, satellite and infrared radiometry.
The basemap
I'll create a basemap as I've shown in other posts.
I'll download it in geoJSON format and convert it into a variable called "countries" in a new file CNTR_RG_01M_2020_4326.js . I need to insert the following heading so it's read correctly (cole the JSON variable with "]}" so it's read correctly).
We'll add the GeoServer functions "?service=WMS&request=GetCapabilities" which will show the available information in the WMS like layers, legends, styles or dimensions.
Find the options values that you need in the metadata file. Specifically these tags:
<Layer queryable="1"><Name> will show the layer names that we can introduce in the proeprty "layers:"
<Style><Name> will show the name for the different styles available to represent the raster map and we'll introduce it in the property "styles:".
<LegenURL> shows a link to the legend used for that style.
<Dimension> will show the units that we can use when querying the WMS. In this case it's a time unit as we can vary the date that the map represents. I'll comment it for the moment so it will show the last available date.
SST raster data
Finally, let's add the legend to the map to have a visual reference.
It's inserted as an image in the <body> and some CSS in <style>:
As you can see, it's hard to try and figure out a value for any of the pixels in the map.
Mimic the legend to query the data
To know the temperature that a pixel represents, we should know the position of such pixel color in the legend, and its proportional value compared to the extreme values (310kPa= 36.85ºC y 210kPa=-3.15ºC).
The problem is that CORS policy won't let you query the image as it's outside our domain. On the other hand, if we add the image to our domain, it will have a low resolution and lose precision in the colors that it shows.
That's why I'll mimic the legend using a <canvas> element.
Using javascript, and the HTML Color Picker, we'll define the different color stops in a "gradient" type fill that will replace the original legend.
	function grad(){
		//Generamos la leyenda en el canvas 'gradientC'
		var ctx=document.getElementById("gradientC").getContext('2d');
		//Definimos un gradiente lineal
		var grd=ctx.createLinearGradient(0,150,0,0);
		//Calibrar las paradas del gradiente tomando muestras de la imagen
		//Descomentar la imagen que va junto al canvas en el html
		//Usar HTML color picker: https://www.w3schools.com/colors/colors_picker.asp
		grd.addColorStop(0, "rgb(0, 0, 146)");			//0 -> -3.15
		grd.addColorStop(0.09, "rgb(0, 0, 247)");		//1
		grd.addColorStop(0.185, "rgb(1, 61, 255)");		//2
		grd.addColorStop(0.26, "rgb(0, 146, 254)");		//3
		grd.addColorStop(0.3075, "rgb(0, 183, 255)");		//4
		grd.addColorStop(0.375, "rgb(3, 251, 252)");	//5
		grd.addColorStop(0.5, "rgb(111, 255, 144)");	//6 -> 20.0
		grd.addColorStop(0.575, "rgb(191, 255, 62)");	//7
		grd.addColorStop(0.64, "rgb(255, 255, 30)");	//8
		grd.addColorStop(0.74, "rgb(255, 162, 1)");		//9
		grd.addColorStop(0.805, "rgb(255, 83, 0)");		//10
		grd.addColorStop(0.90, "rgb(252, 4, 1)");		//11
		grd.addColorStop(1, "rgb(144, 0, 0)");			//12 -> 36.85

		//añadir el gradiente al canvas
		ctx.fillStyle = grd;
		ctx.fillRect(0,0,255,255);
	}

	//ejecutamos la funcion del gradiente al inicio
	grad();
SST raster data
Pixel selector creation and temperature calculator
Once we have our own legend, we create another element that shows the selected pixel as well as the temperature obtained.
To use the pixel color, we'll add another <canvas>:
	<canvas id="temp">
		<img id="pixel" src="" ALT="CLICK PARA OBTENER TEMPERATURA"></img>
	</canvas>

	<div id="tempTxt">PINCHA SOBRE EL MAR PARA CONOCER SU TEMPERATURA</div>
onMapClick() to obtain the selected pixel and pass it to the lower box. We use a GET request of the WMS service using the coordinates of the pixel location. It's important to take into account the reference system which is not the usual (EPSG:3857) for unit conversions.
	//Añadimos función al hacer click en el mapa
	map.addEventListener('click', onMapClick);

	function onMapClick(e) {
		//ejecutamos la función grad con cada click
		grad();
		//Obtenemos las coordenadas del pinto seleccionado
        var latlngStr = '(' + e.latlng.lat.toFixed(3) + ', ' + e.latlng.lng.toFixed(3) + ')';
		//console.log(latlngStr);

		//Definir el CRS para enviar la consulta al WMS
		const proj = L.CRS.EPSG3857;
        //const proj = L.CRS.EPSG4326;

		//Definimos los límites del mapa que pediremos al WMS para que sea aproximadamente de 1 pixel
		var BBOX=((proj.project(e.latlng).x)-10)+","+((proj.project(e.latlng).y)-10)+","+((proj.project(e.latlng).x)+10)+","+((proj.project(e.latlng).y)+10);

		//console.log(BBOX);

		//Restablecemos la imagen en cada click
		var tTxt=document.getElementById("tempTxt");
		var pix= document.getElementById("pixel");
		var ctx=document.getElementById("temp").getContext("2d");
		//pix.src="";
		ctx.fillStyle="lightgrey";
		ctx.fillRect(0,0,300,300);

		//Realizamos la petición del pixel seleccionado
		var xPix= new XMLHttpRequest();
		xPix.onreadystatechange = function(){
			if (this.readyState == 4 && this.status == 200) {
				pix.src=URL+WMS+BBOX;
				pix.onload=function(){
					ctx.drawImage(pix,0,0,300,300);
					tTxt.innerHTML="INTERPRETANDO LEYENDA...";
					//Interpretamos el pixel según la leyenda
					leyenda();
				}
				pix.crossOrigin="anonymous";
			}
		};

		xPix.open("GET", URL+WMS+BBOX);
		xPix.send();

		tTxt.innerHTML="CARGANDO TEMPERATURA...";


    }
leyenda() calculates the temperature of the selected pixel according to our legend. It shows the value in the lower box and also adds a white indication mark in the legend. The calculation algorithm consists in running the legend pixel by pixel (vertically) and comparing the difference of the rgb(x,y,z) values of the legend with the rgb values in the selected pixel. We'll be keeping the minimum difference until we reach the last pixel, so there will be situations where the solution is not 100% exact. This is not the best way, but it's fast (to understand and execute) and quite effective.
	function leyenda(){
		var ctx=document.getElementById("temp").getContext("2d");
		var tTxt=document.getElementById("tempTxt");
		//obtenemos el valor RGB del pixel seleccionado
		var RGB=ctx.getImageData(5,5,1,-1).data;
		//console.log(ctx.getImageData(10,10,1,-1).data);

		var key=document.getElementById("gradientC").getContext("2d");
		var max=150;

		var min=1000;//la máxima diferencia sólo puede ser de 255x3=765
		var dif="";
		var val="";

		//recorremos el gradiente de la leyenda pixel a pixel para obtener el valor de temperatura
		for(var p=1;p<=max;p++){
			//obtenemos el valor actual
			var temp=key.getImageData(1,p,1,-1).data;
			//console.log(temp);
			//comparamos con el seleccionado y obtenemos la diferencia total
			dif=Math.abs(parseInt(temp[0])-parseInt(RGB[0]))+Math.abs(parseInt(temp[1])-parseInt(RGB[1]))+Math.abs(parseInt(temp[2])-parseInt(RGB[2]));
			if(dif<min){
				min=dif;
				val=p;
				//console.log("Obj:"+RGB[0]+","+RGB[1]+","+RGB[2]+"\nTemp:"+temp[0]+","+temp[1]+","+temp[2]+"\nDif:"+dif);
			}
		}
		var T=36.85-(val*40/max);
		T=T.toFixed(2);
		//pintamos una línea de referencia en la leyenda
		key.fillStyle="white";
		key.fillRect(0,val,255,1);

		//definimos la temperatura en el texto
		//si el color da gris, hemos pinchado en la tierra
		//console.log("T= "+T);
		if(RGB[0]==211&RGB[1]==211&RGB[2]==211){
			tTxt.innerHTML="PINCHA SOBRE EL MAR PARA CONOCER SU TEMPERATURA";
		}else if(typeof T == "undefined"){
			tTxt.innerHTML="¡ERROR!<BR>PRUEBA OTRO PUNTO DEL MAR.";
		}else{
			tTxt.innerHTML="TEMPERATURA APROXIMADA: <br><br>"+T+" ºC";
		}
		//console.log(key.getImageData(1,150,1,-1).data);
	}
We also ommit the original legend and add some custom text.
	//Obtener última hora de actualizacion del mapa
	var timeInp=document.getElementById("timeInp");
	var t;
    var maxT;
    var minT;
	var xTime = new XMLHttpRequest();
		xTime.onreadystatechange = function(){
			if (this.readyState == 4 && this.status == 200) {
				//convertimos el XML según https://www.w3schools.com/xml/xml_parser.asp
                var xmlDoc=this.responseXML;
                t=xmlDoc.children[0].children[1].children[2].children[12].children[1].children[5].attributes[4].value;
                //Lo convertimos en un objeto fecha quitando los segundos
        		t=new Date(t);
                t=t.toISOString().substring(0,t.toISOString().length-8);
                //Lo pasamos al selector y lo establecemos como máximo
                timeInp.max=t;
                timeInp.value=t;
                maxT=new Date(t);

                //también establecemos el minimo
                t=xmlDoc.children[0].children[1].children[2].children[12].children[1].children[5].innerHTML.trim();
                t=t.substring(0,16);
                timeInp.min=t;
                minT=new Date(t);
			}
		};

		xTime.open("GET", URL+"?service=WMS&request=GetCapabilities");
		xTime.send();

	//Selector de fecha para WMS

	timeInp.addEventListener("change", function(){
		t=new Date(timeInp.value.toString());
		t.setHours(12-t.getTimezoneOffset()/60);
        t=t.toISOString().substring(0,t.toISOString().length-8);
	    timeInp.value=t;
	    t=new Date(timeInp.value);
            t.setHours(12-t.getTimezoneOffset()/60);

        //si estamos en el rango de datos..
        if(t>=minT && t<=maxT){
		    t=t.toISOString();
            //actualziamos el mapa
		    base.setParams({
			    time: t,
			    styles: "boxfill/rainbow",
		    },0);
        }else{//mostramos error
            alert("La fecha introducida está fuera de rango.");
        }
	});

    //funcion de reinicio de fecha
    function reiniT(){
        timeInp.value=maxT.toISOString().substring(0,maxT.toISOString().length-13)+"23:30";
    }
Result
Joining it all, you'll end up with something like this, which you can see fullscreen here:
If you liked this, have any doubts or any idea to improve this or other maps, drop your thought in Twitter 🐦
I also add <meta> charset(1) and viewport(2) properties to (1)correctly read special characters in the data and (2) adjust the window correctly for mobile devices.
As you can see, I add border:0 and margin:0 to <body> style. This adjusts the map to fit the window without white spaces.
Height:100vh and width:100vw adjust the map to fit the size of the screen, even when we resize (view height and view width). z-index will be used to place elements in order and avoid overlays.
Now we can generate the map with javascript in the <script> block.
With L.map we define the map and the initial view (centered in Madrid).
With L.tileLayer.wms we add the WMS service to get an "onlin" basemap. You can find the URLs for each service in the metadata files that come with each product.
It's also usual that WMS come with several layers and we need to define one. We can get a list of layers using the GetCapabilities WMS function. In my case, its the <Layer> with <Name> "IGNBaseTodo-gris" found here:
Finally, to see the app in one click on a smartphone, you need to copy the content in leafMET.js and add it inside the <script> tags in the .html
This way, you'll have a single file with all it's needed to run the webapp. I added <title> and "icon" tags in the <head> to show a page title and an icon in the shortcut.