Today I’m sharing a very simple yet effective and elegant PS5 controller hanger.
Some concept/design images:
It just stands on its own without any screwing or glueing. It hangs from the PS5 itself and it’s expandable by design (probably you can fit up to 4 controllers just on one side).
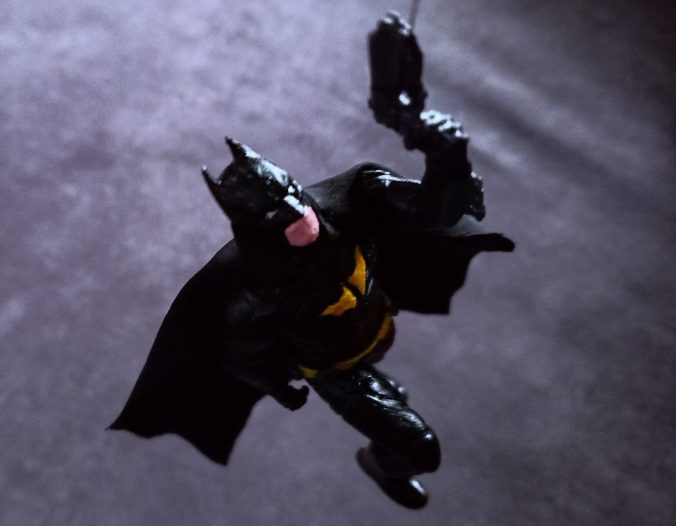
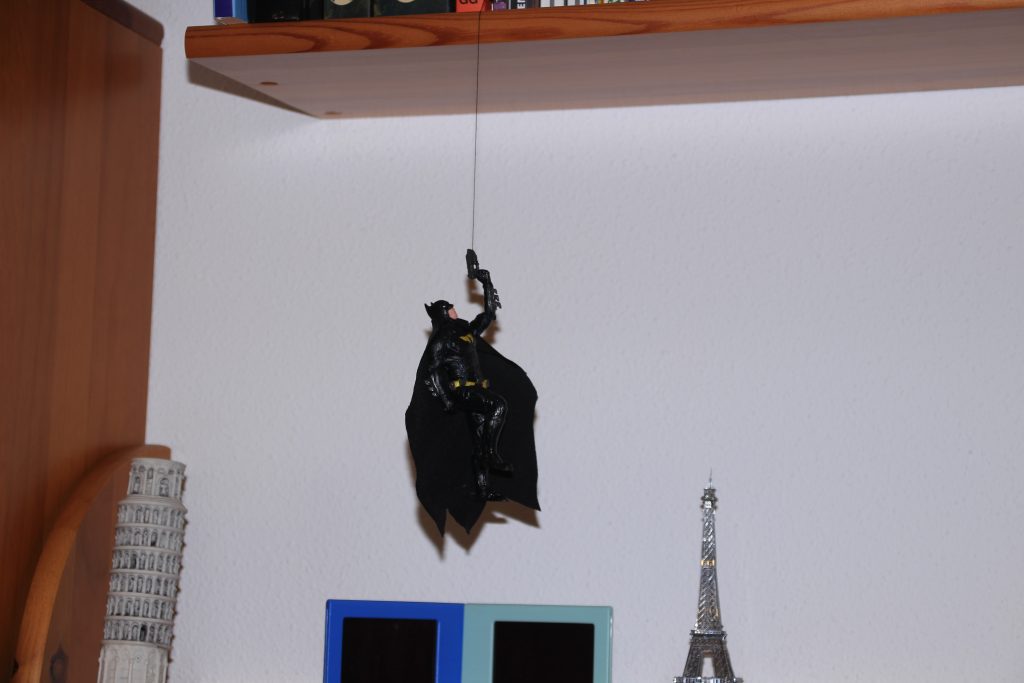
The truth is that resin printing is next level. Despite the complications of cleaning, the result is really incredible, and today I’m showing you my first print in the Anycubic Photon Mono X2: a Batman you can hang in your living-room with his grappling gun.
Content
Models
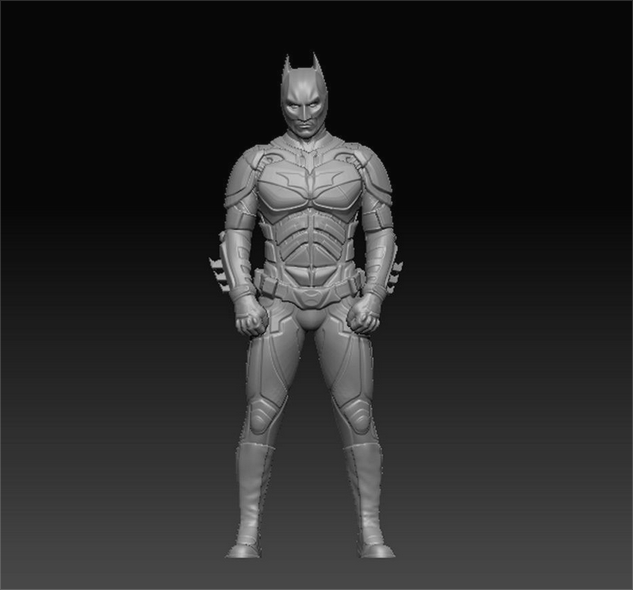
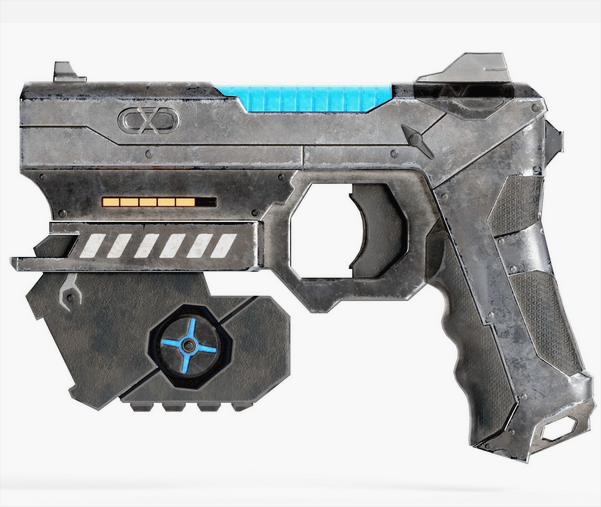
The print that you see is made of two free models. That's why here's a huge thank to the authors and my reference to their work:
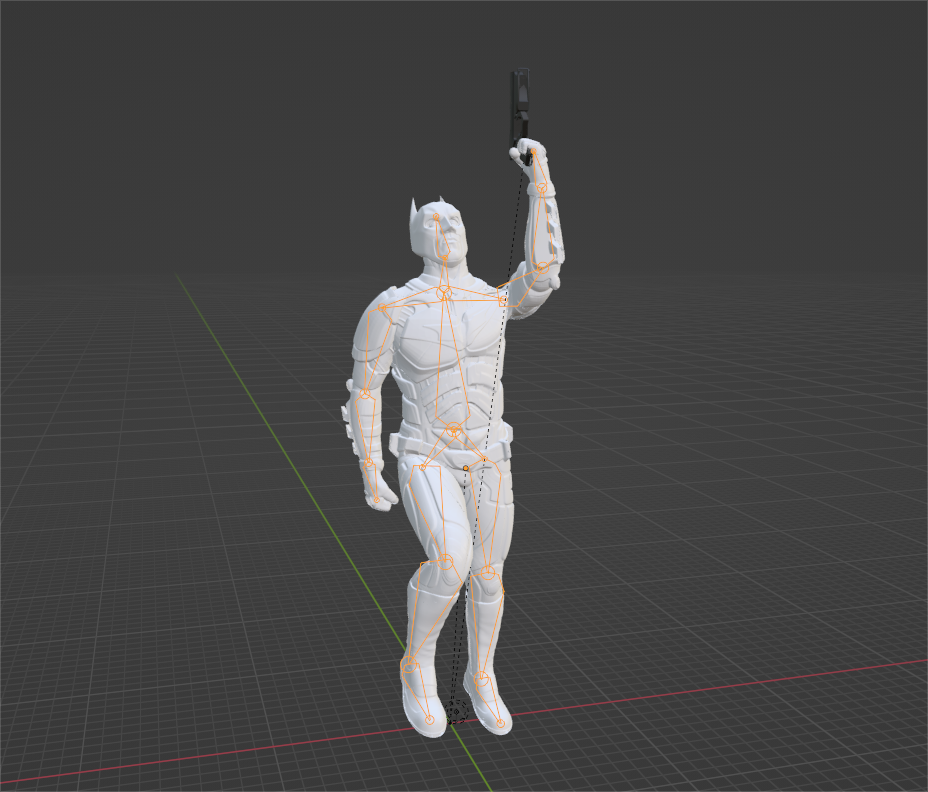
All I've done is to add an armature to the model giving it the desired pose, and then sticking the gun to its hand. So here is my model so you can print it just as shown.
To finish the figure, you can create a cape and a hook so it can be hanged.
Cape
For the cape I've cut out a piece of fabric from an old sportswear. This is common clothing that's usually black and with an adequate brightness and texture.
Start cutting a square piece and then give it some shape.
In the top part, wrap a wire that will let you adjust the cape around the figure's neck.
Hook
Just find some kind of hook or clamp that lets you tie a thin thread around it. I've used this small paper clamp that I can hook in the books of my shelf.
And that's how you get your awesome Batman hanging in your living-room. Hope you liked it, and any ideas or comments, drop them on Twitter!
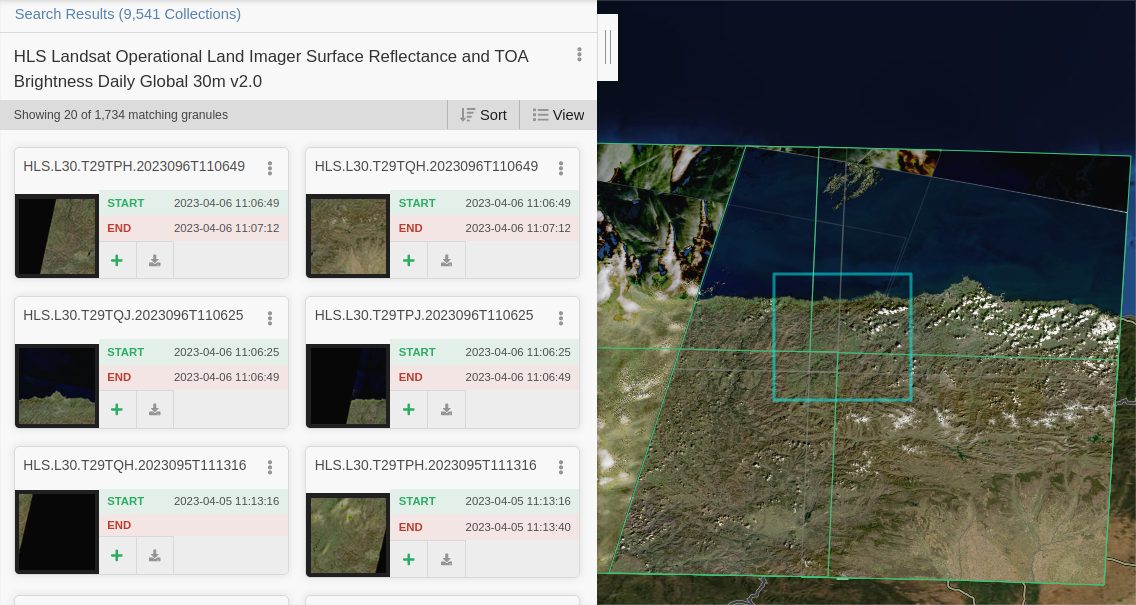
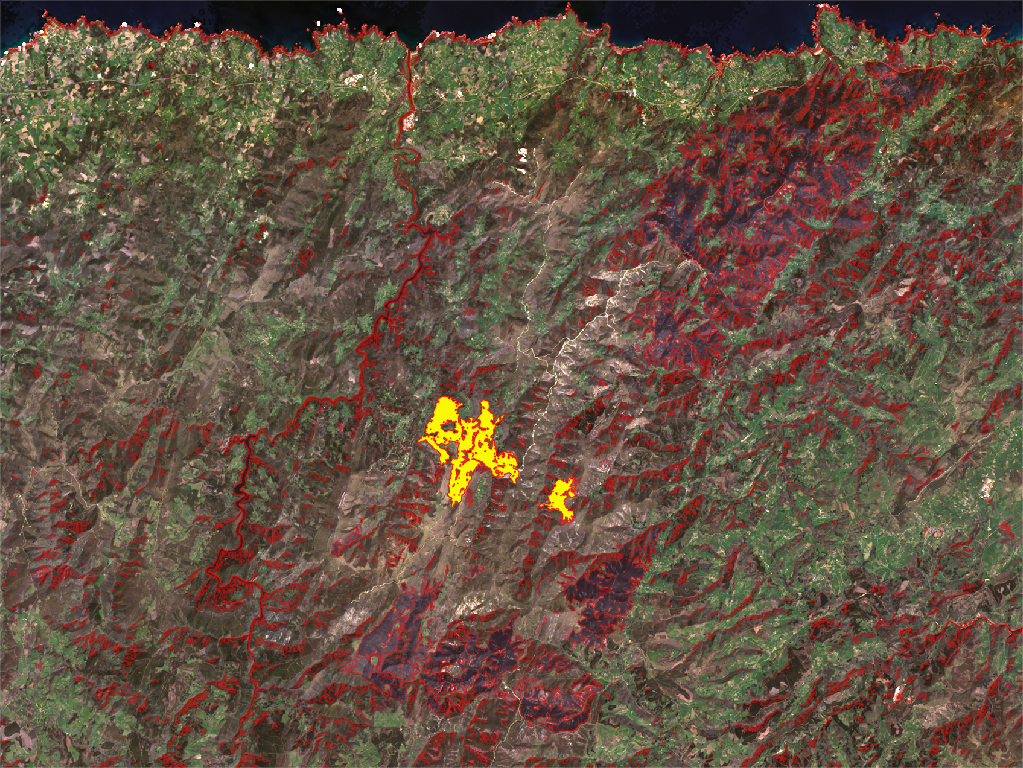
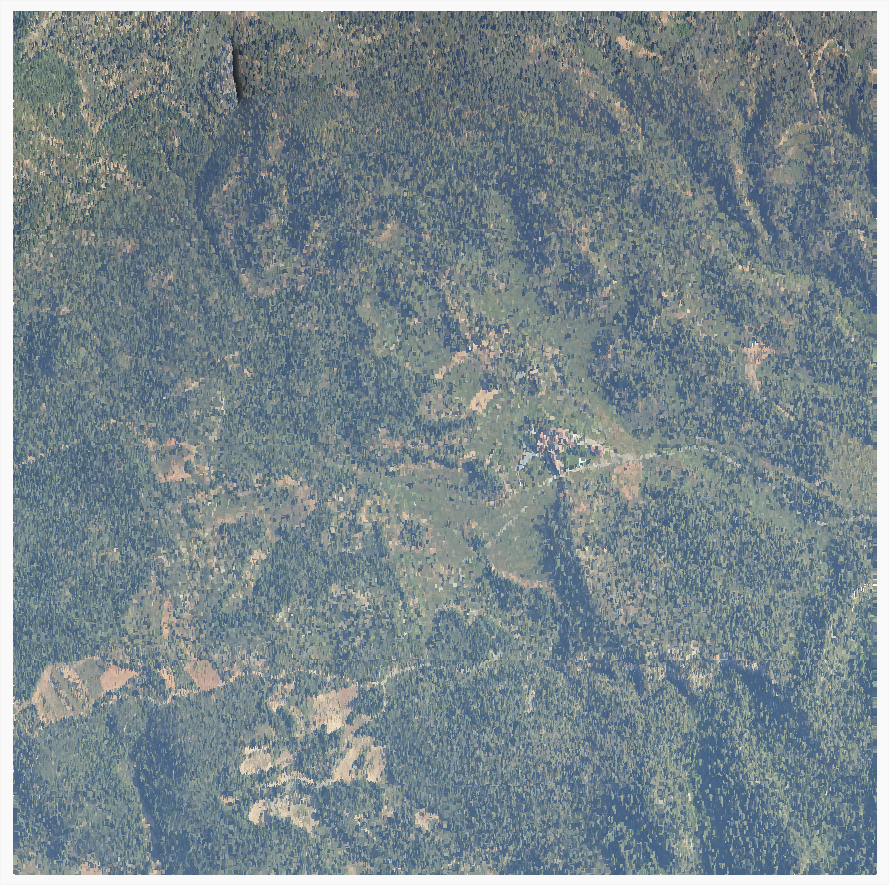
After a few posts about the use of satellite information, let’s see how to bring it (almost) all together in a practical and impacting example. And it’s given the latest wildfires occurred in Spain that they’ve called my attention as I could not imagine how brutal they have been (although nothing compared to the ones in Chile, Australia or USA). But let’s do the exercise without spending too much GB in geographical information.
What I want is to show the extent of the fire occurred in Asturias in March, but also to show the impact removing the trees affected by the flames. Let’s do it!
Content
Download data
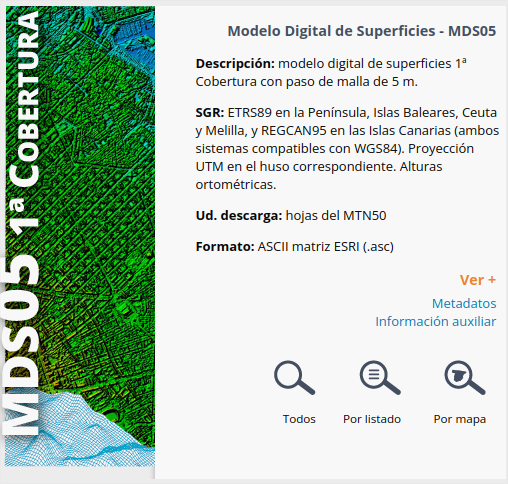
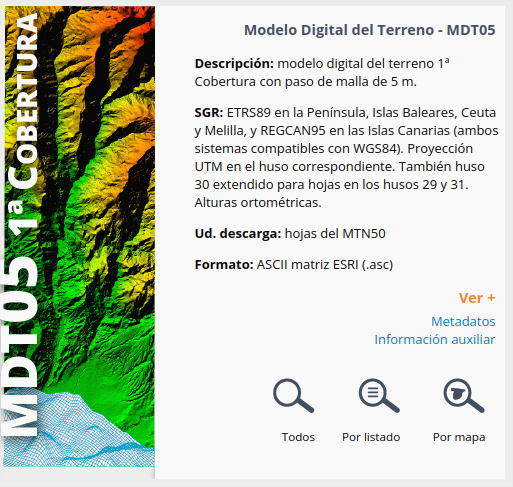
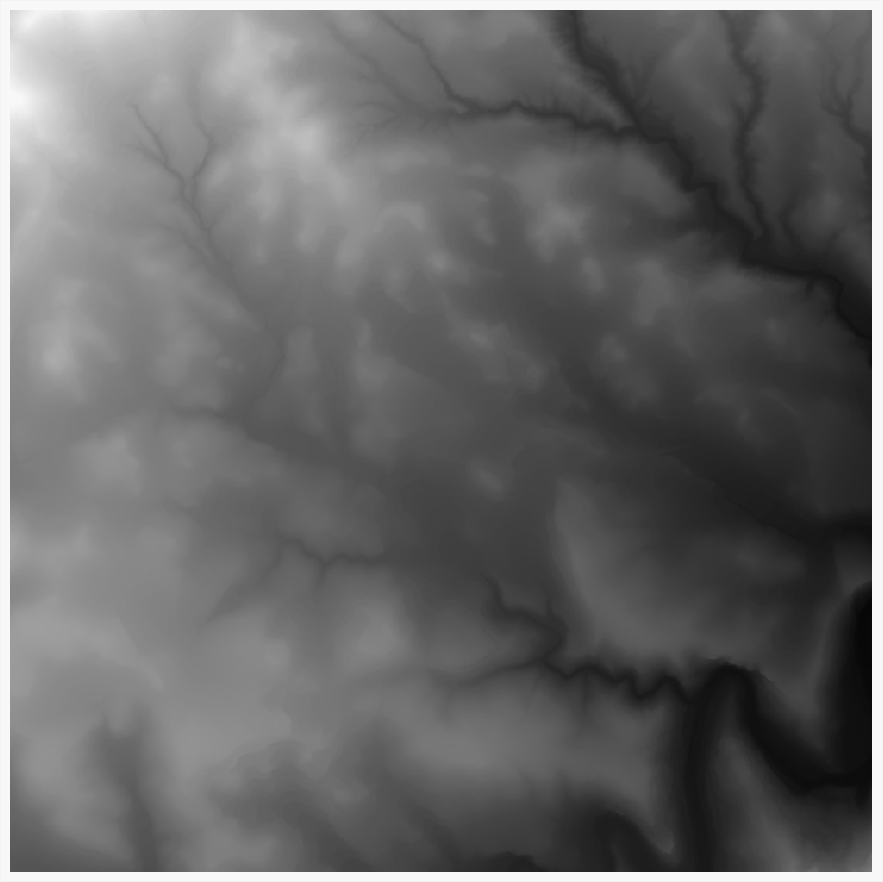
I will need a Digital Surface Model (which includes trees and structures), an orthophoto taken during the fire, and a Digital Terrain Model (which has been taken away trees and structures) to replace the areas affected by the fire.
1. Terrain models
I'm going to use the great models from Spanish IGN, downloading the products MDS5 and MDT5 for the area.
We'll use the process i.group from GRASS in QGIS to group the different bands captured by the satellite in a single RGB raster, as we saw in this previous post:
You'll have to do it for every region downloaded, four in my case, that will be joint later using Build virtual raster
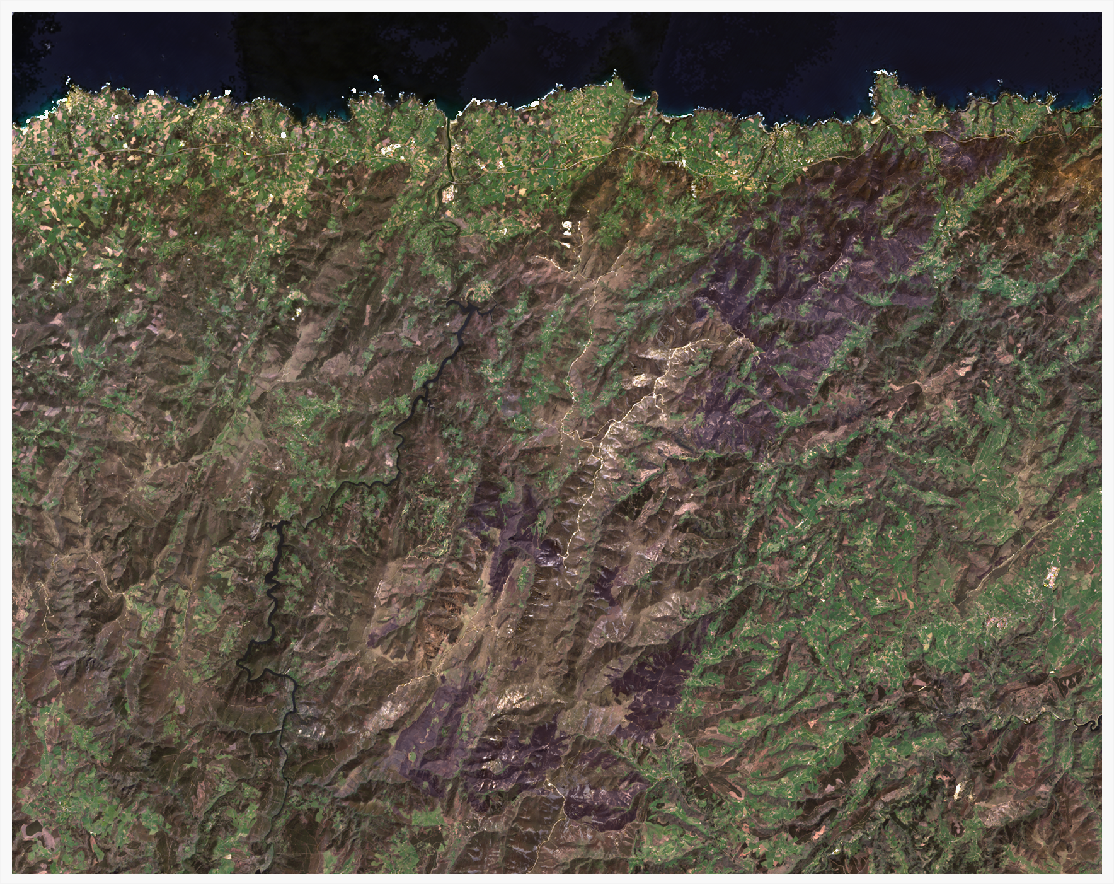
1. True color image (TCI)
Combine bands 4, 3, 2.
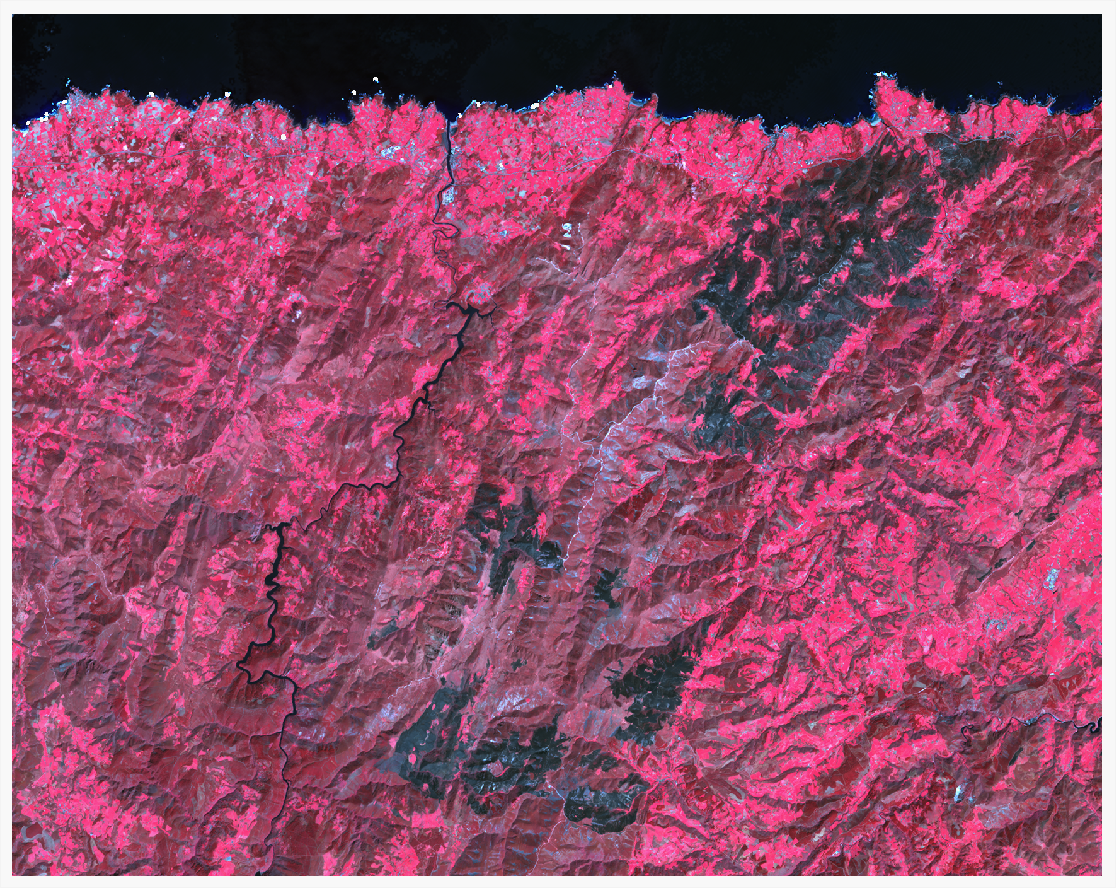
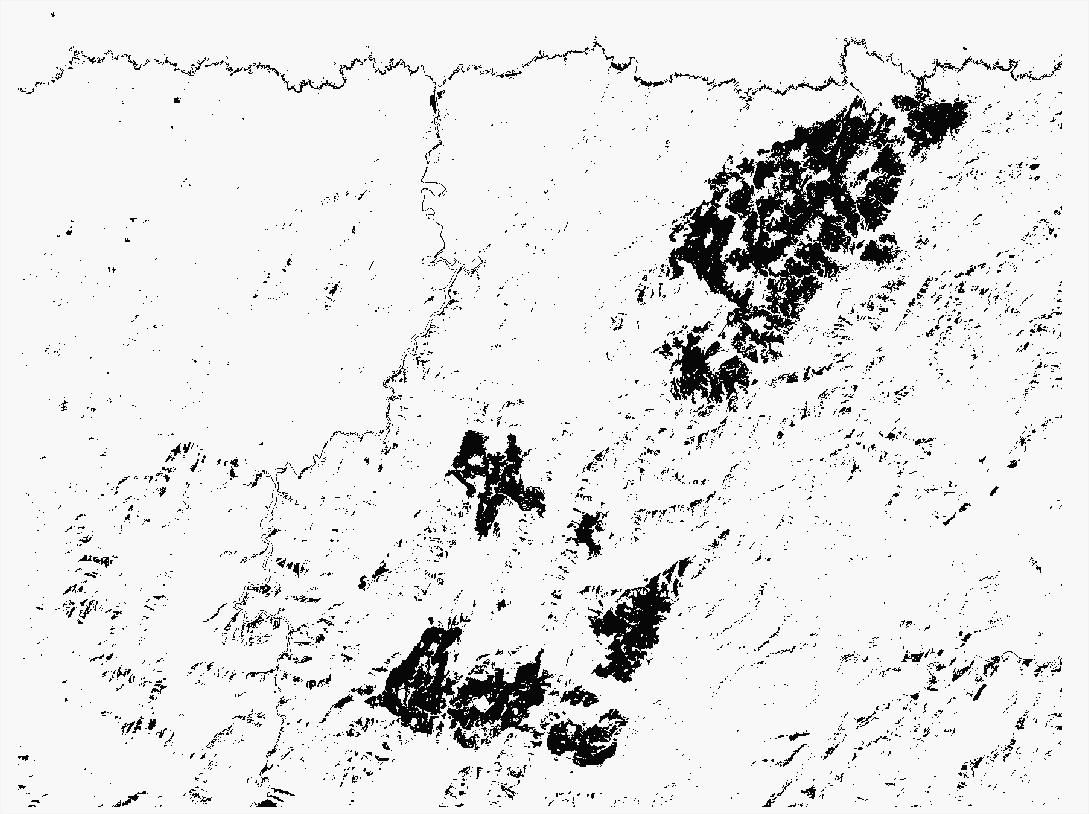
2. False color image
Combine bands 5, 4, 3.
3. Color adjustment
To get a better result, you can adjust the minimum and maximum values considered in each band composing the image. These values are found in the Histogram inside the layer properties.
here you have the values I used for the pictures above::
Band
TCI min
TCI max
FC min
FC max
1 Red
-100
1500
-50
4000
2 Green
0
1500
-100
2000
3 Blue
-10
1200
0
1200
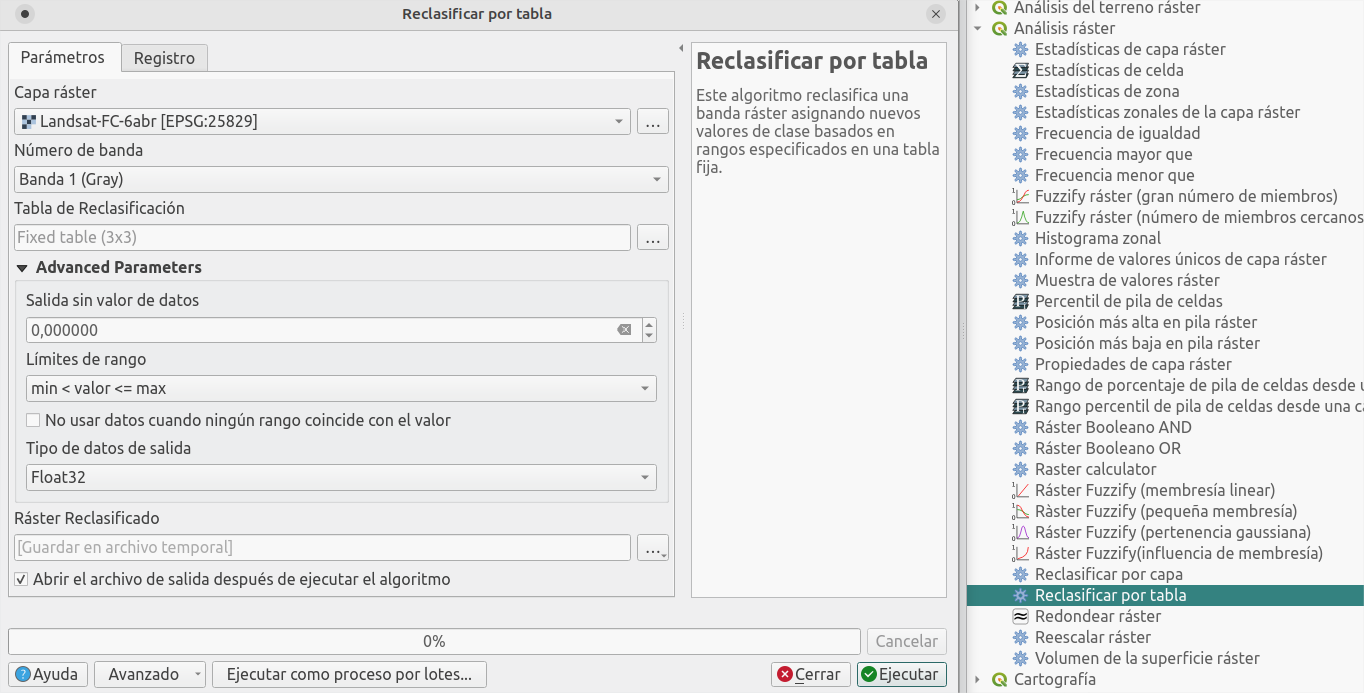
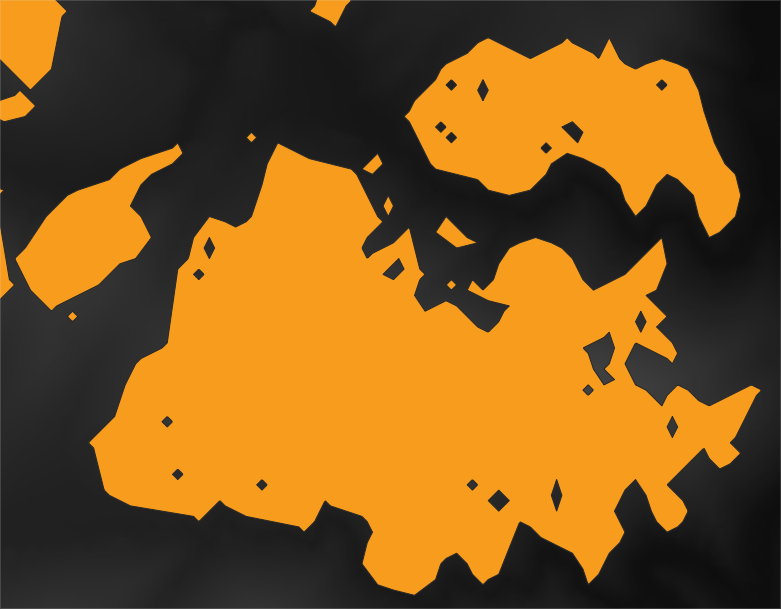
Fire extent
As you can see, the false color image shows a clear extension of the fire. We'll generate a polygon covering the extent of the fire with it.
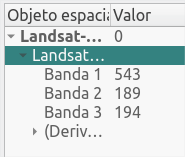
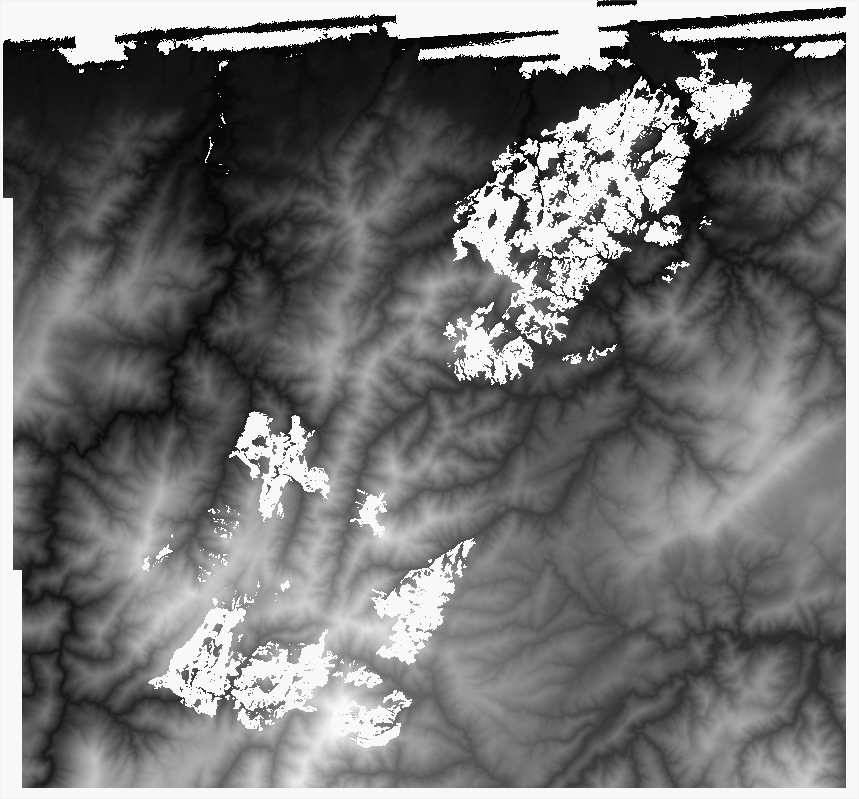
First, let's query the values in Band 1 (red) which offers a good contrast for values in the area of the fire. They are in the range 300-1300.
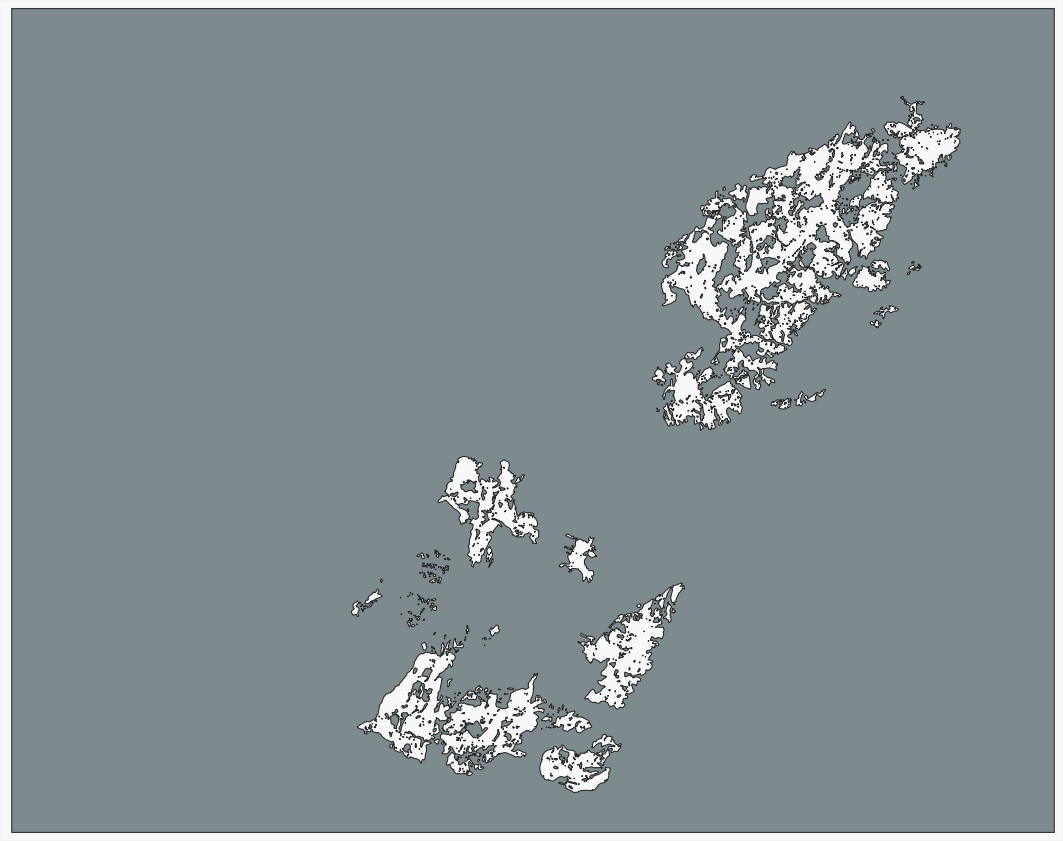
Using the process Reclassify by table, we'll assign value 1 to the cells inside this range, and value 0 to the rest.
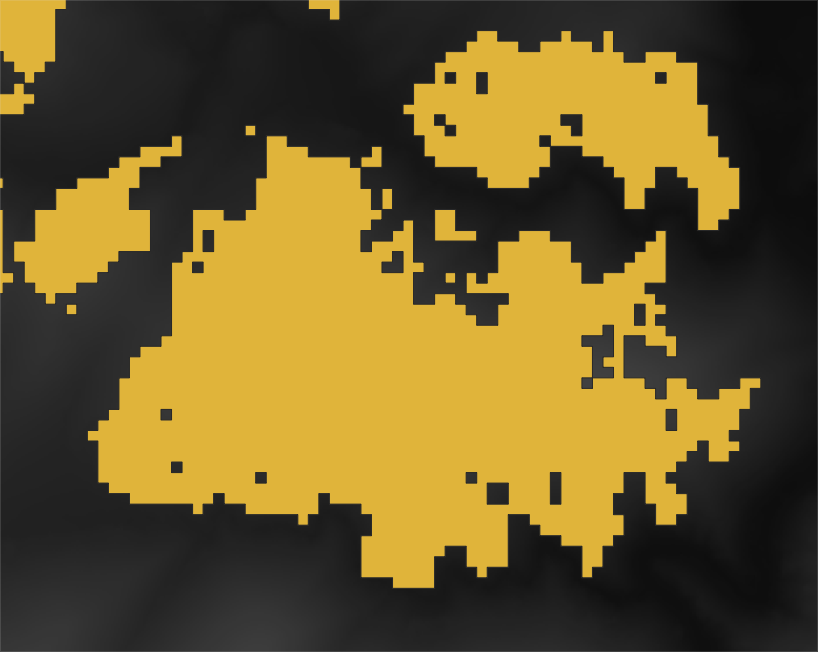
Vectorize the result with process Poligonize and, following the satellite imagery, select those polygons in the fire area.
Use the tool Dissolve to merge all the polygons in one element; then Smooth to round the corners slightly.
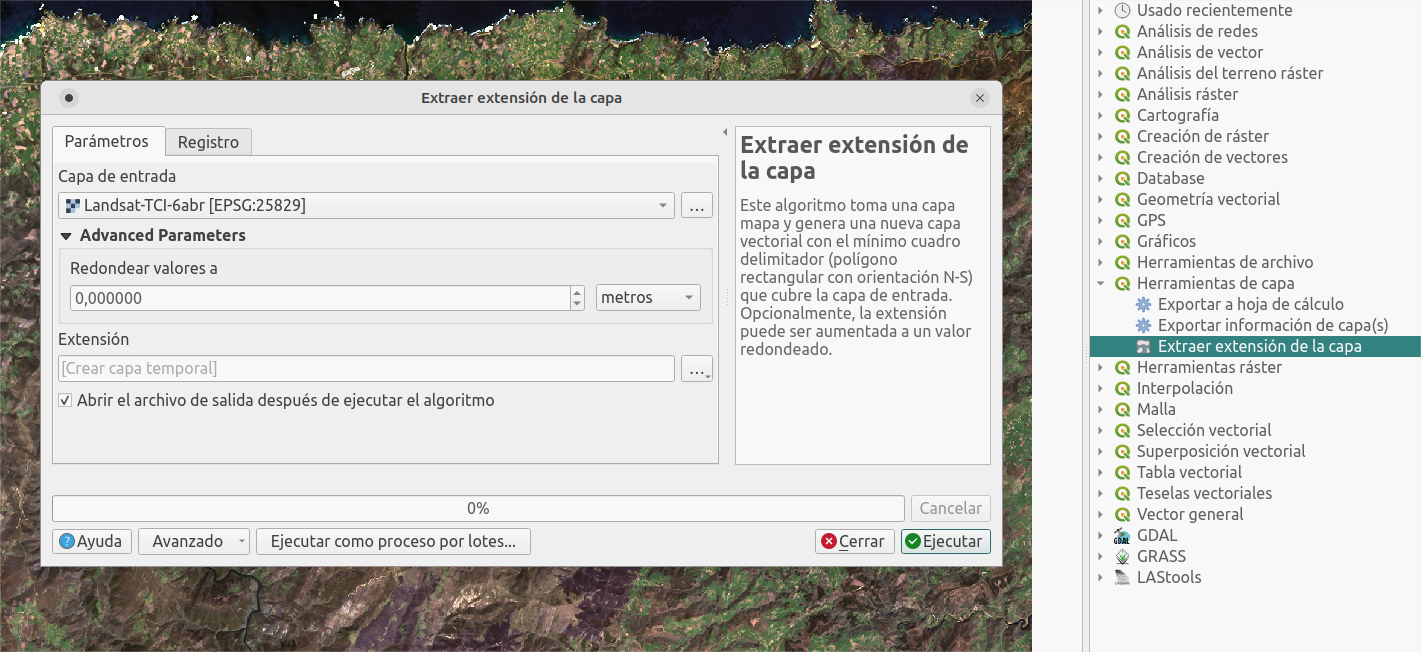
Let's now get the inverse. Extract by extent using the Landsat layer, then use Difference with the fire polygon.
Process terrain
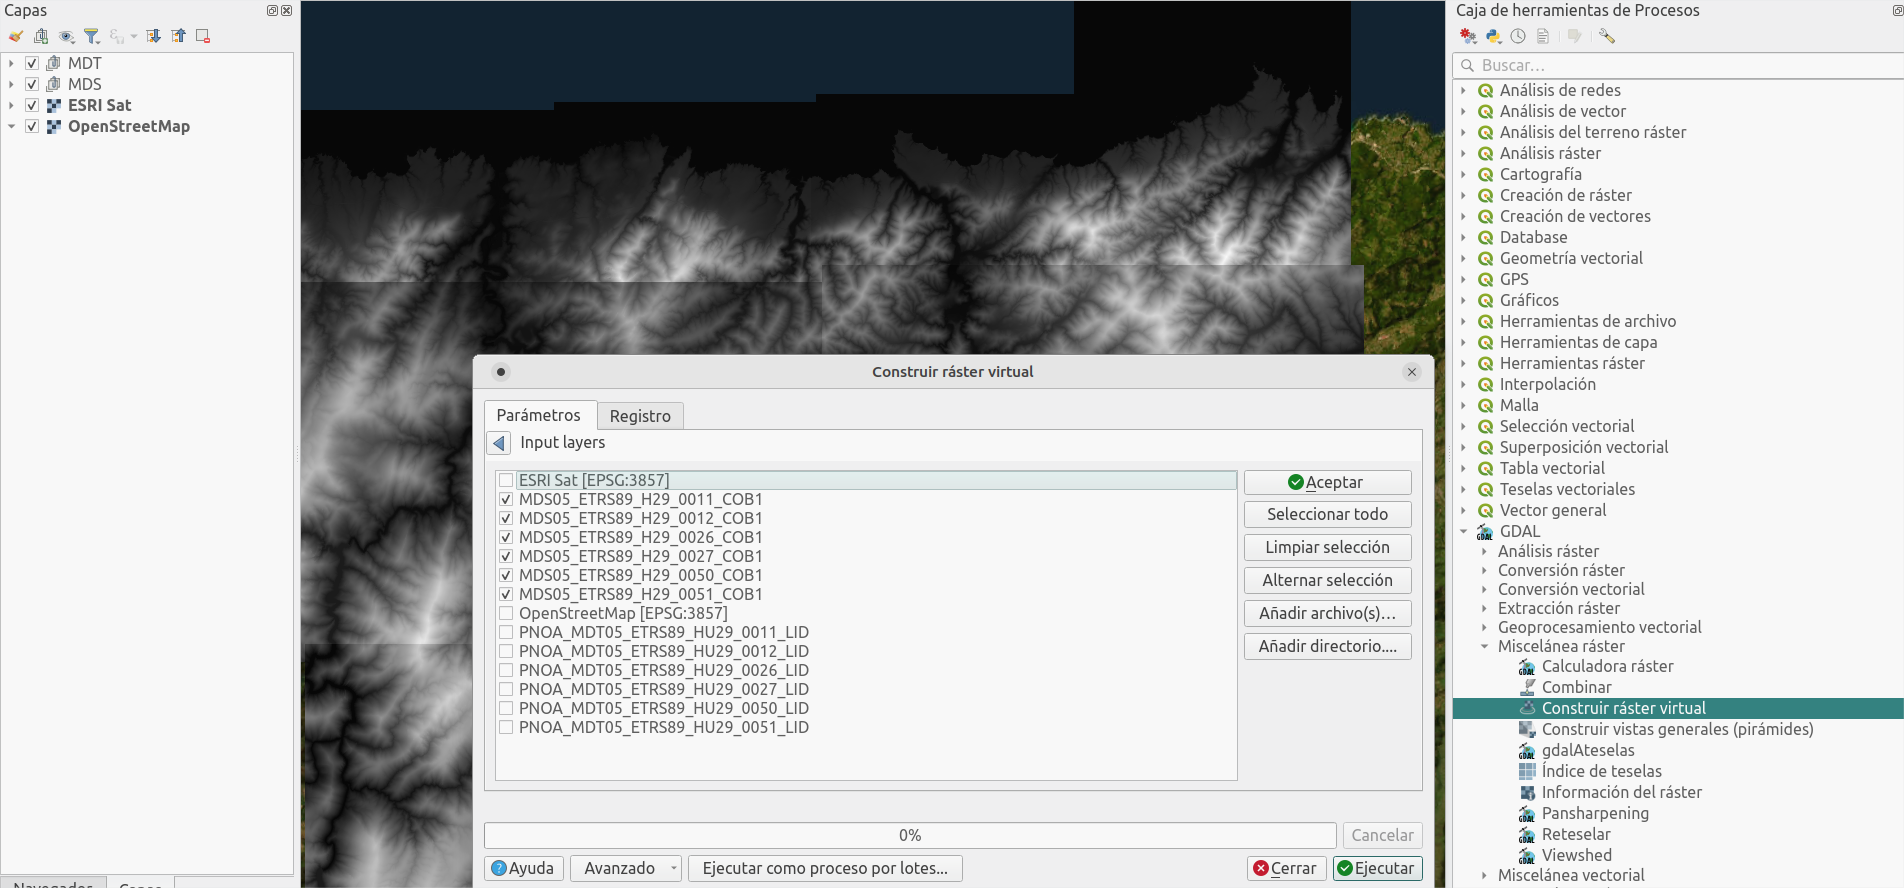
1. Combine terrain data
Join the same type model files in one (one for the DSM, and another one for the DTM). Use process Build virtual raster
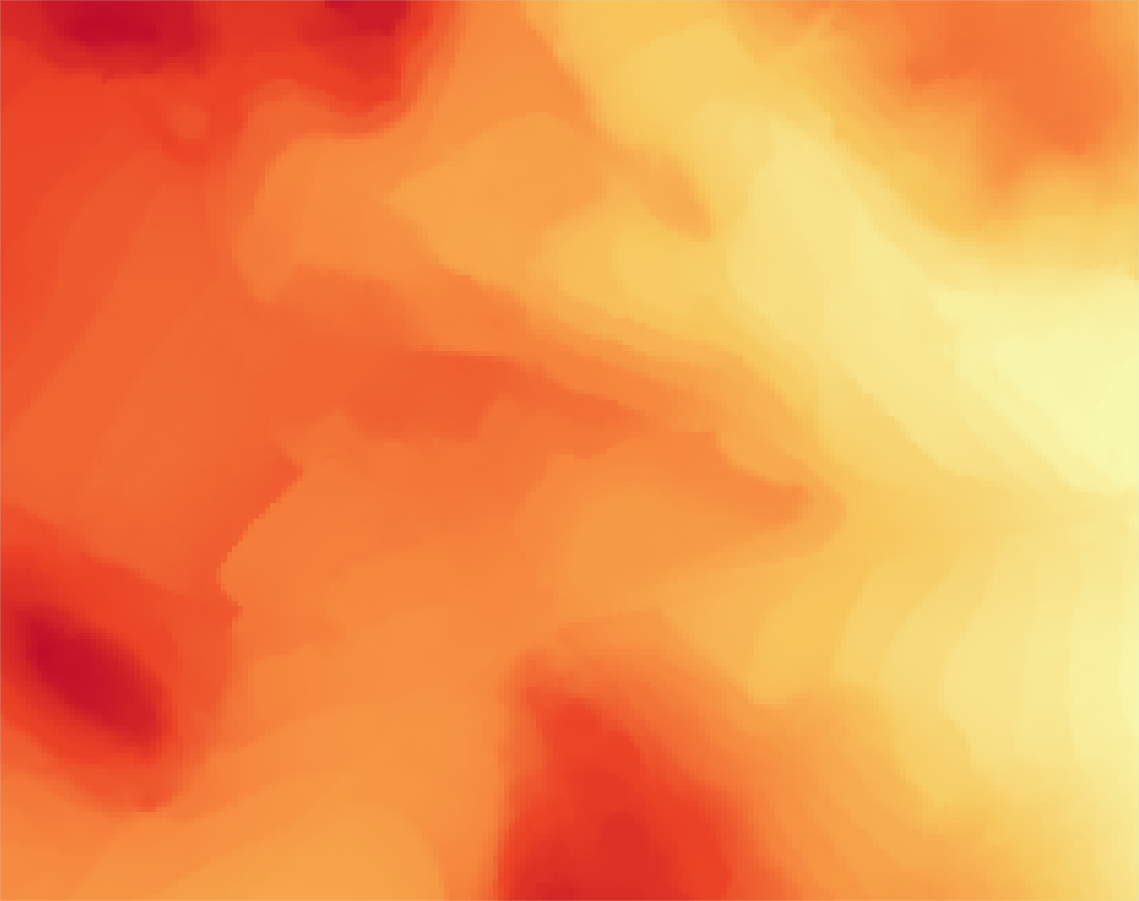
2. Extract terrain data
Extract the data of interest in each model:
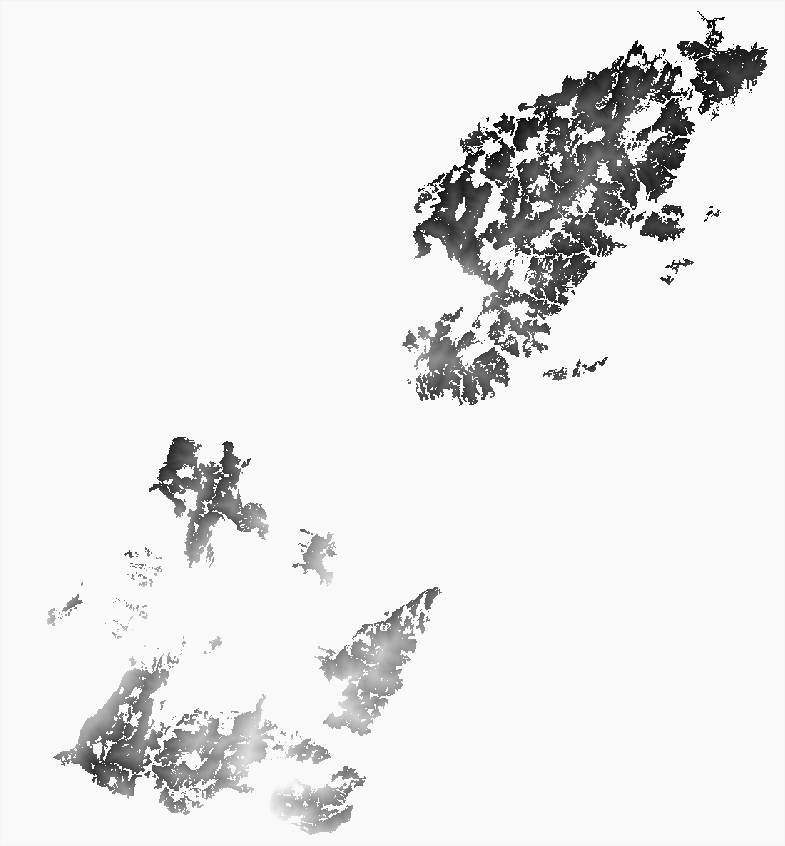
From the DSM extract the surface affected by the fire, so you'll remove all the surface in it.
Do the opposite with the DTM: keep the terrain (without trees) in the fire area, so it will fill the gaps in the other model.
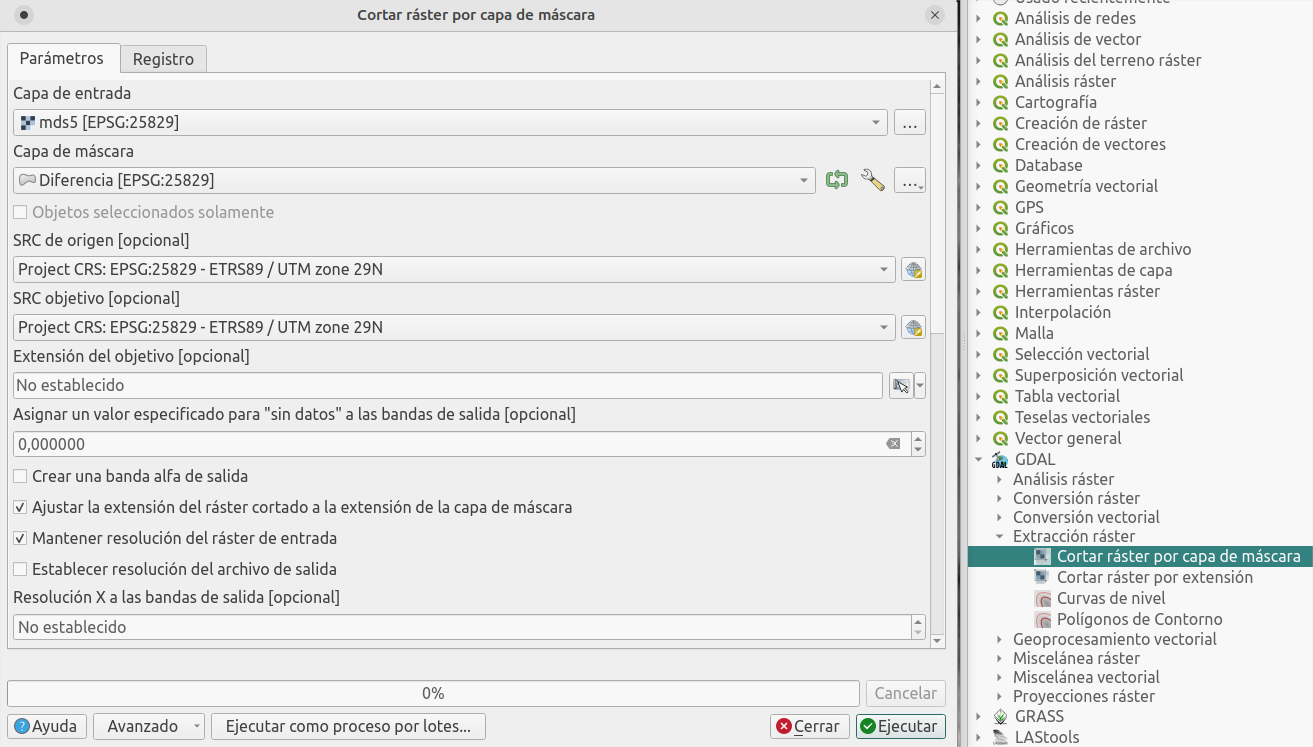
Use the process Crop raster by mask layer using the layers generated previously.
Finally join both raster layers, so they fill each others' gaps, using Build virtual raster.
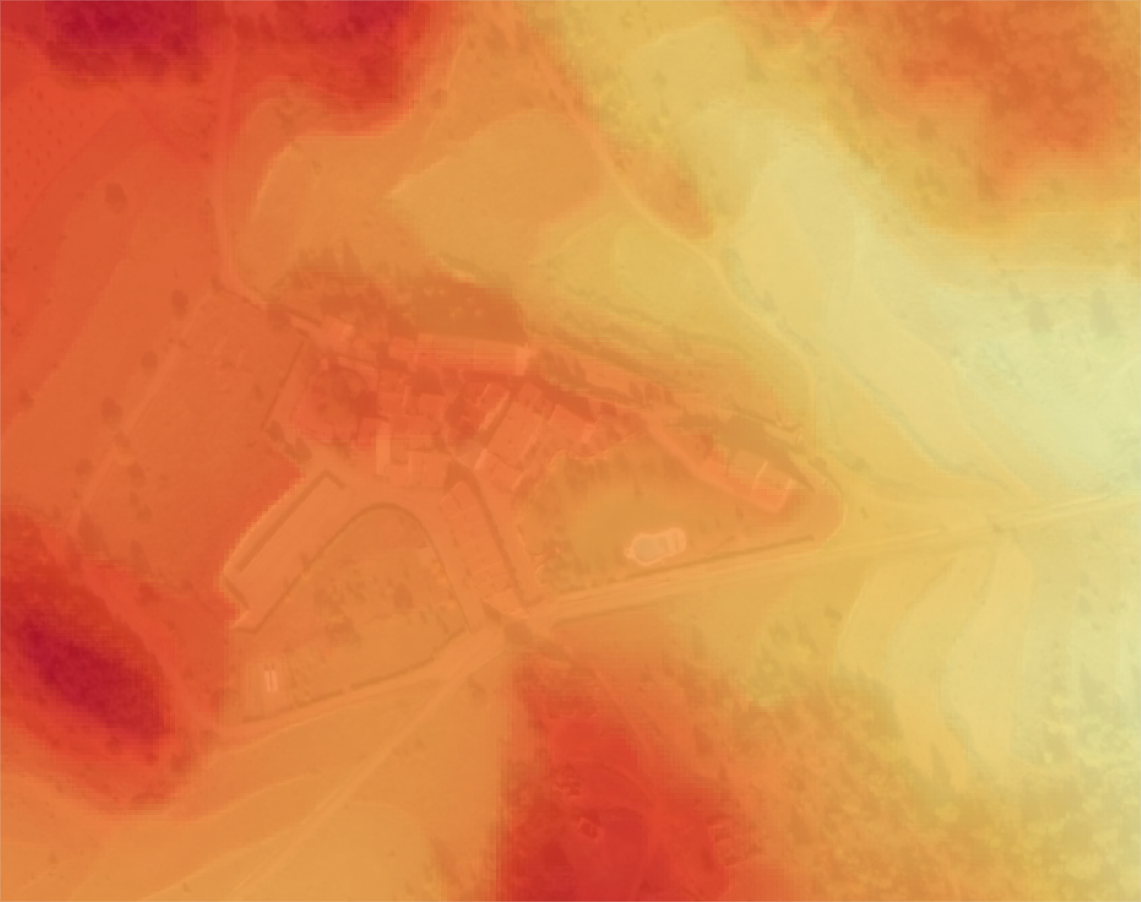
Bring it to life with Cesium JS
You should already have a surface model without trees in the fire area, but let's try to explore it in an interactive way.
I showed a similar example, using a custom Digital Terrain Model, as well as a recent satellite image, for the Tajogaite volcano in La Palma:
In this case I'll use Cesium JS again to interact easily with the map (follow the post linked above to see how to upload your custom files to the Cesium JS viewer).
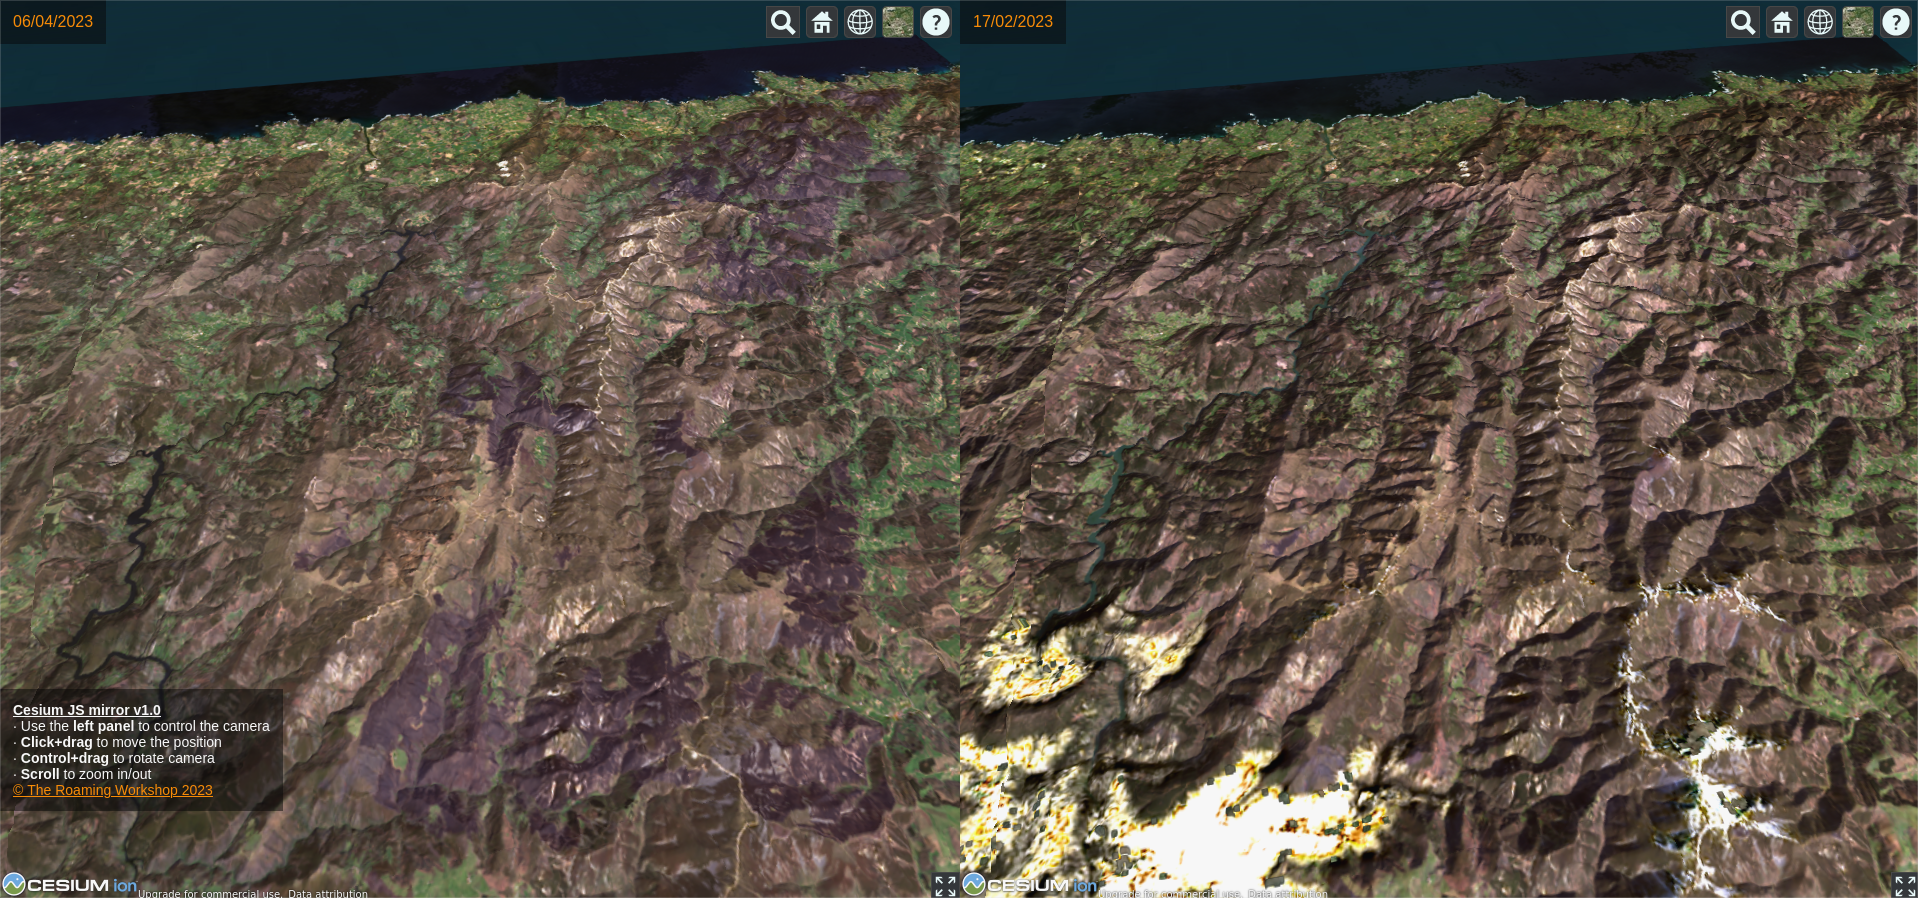
For this purpose, I created a split-screen viewer (using two separate instances of Cesium JS) to show the before and after picture of the fire. Here you have a preview:
I hope you liked it! here you have the full code and a link to github, where you can download it directly. And remember, share your doubts or comments on twitter!
Sometimes a Digital Terrain Model (DTM) might not be detailed enough or poorly cleaned. If you have access to LIDAR data, you can generate a terrain model yourself and make the most of the raw information giving more detail to areas of interest. Let’s see how.
Content
1. Data download
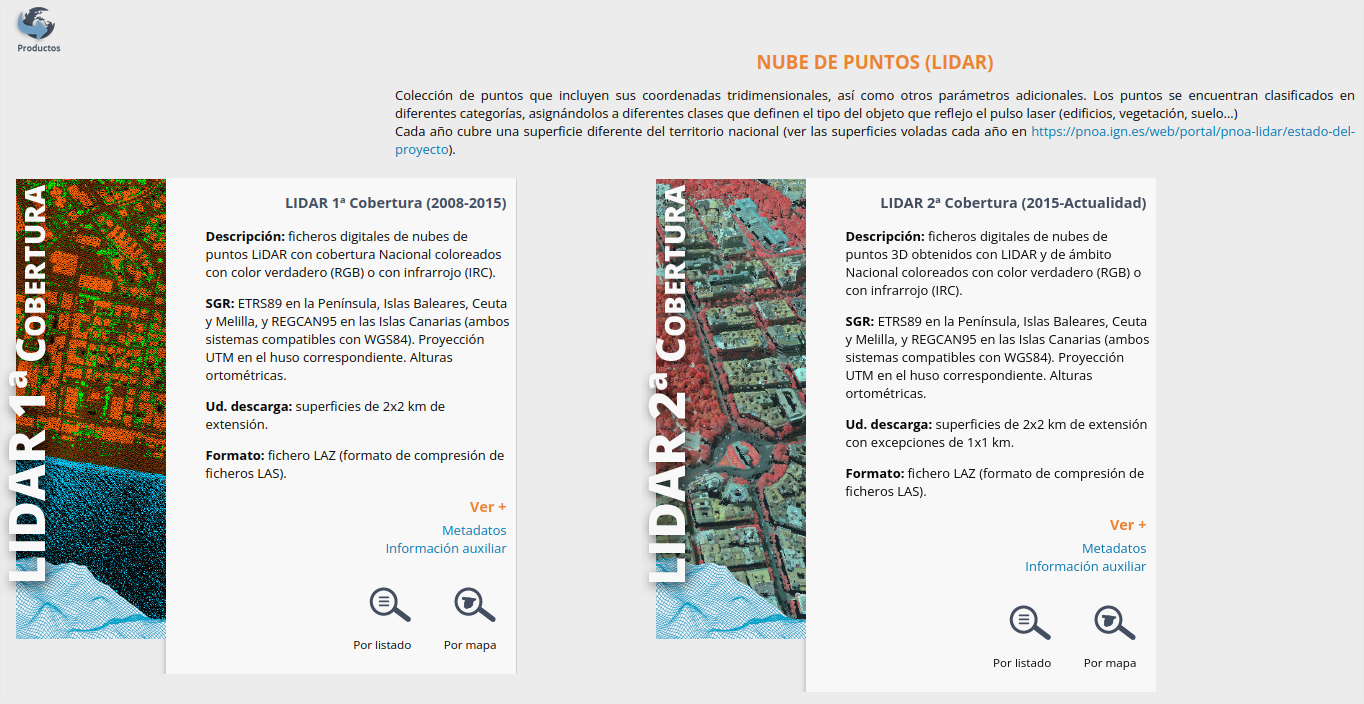
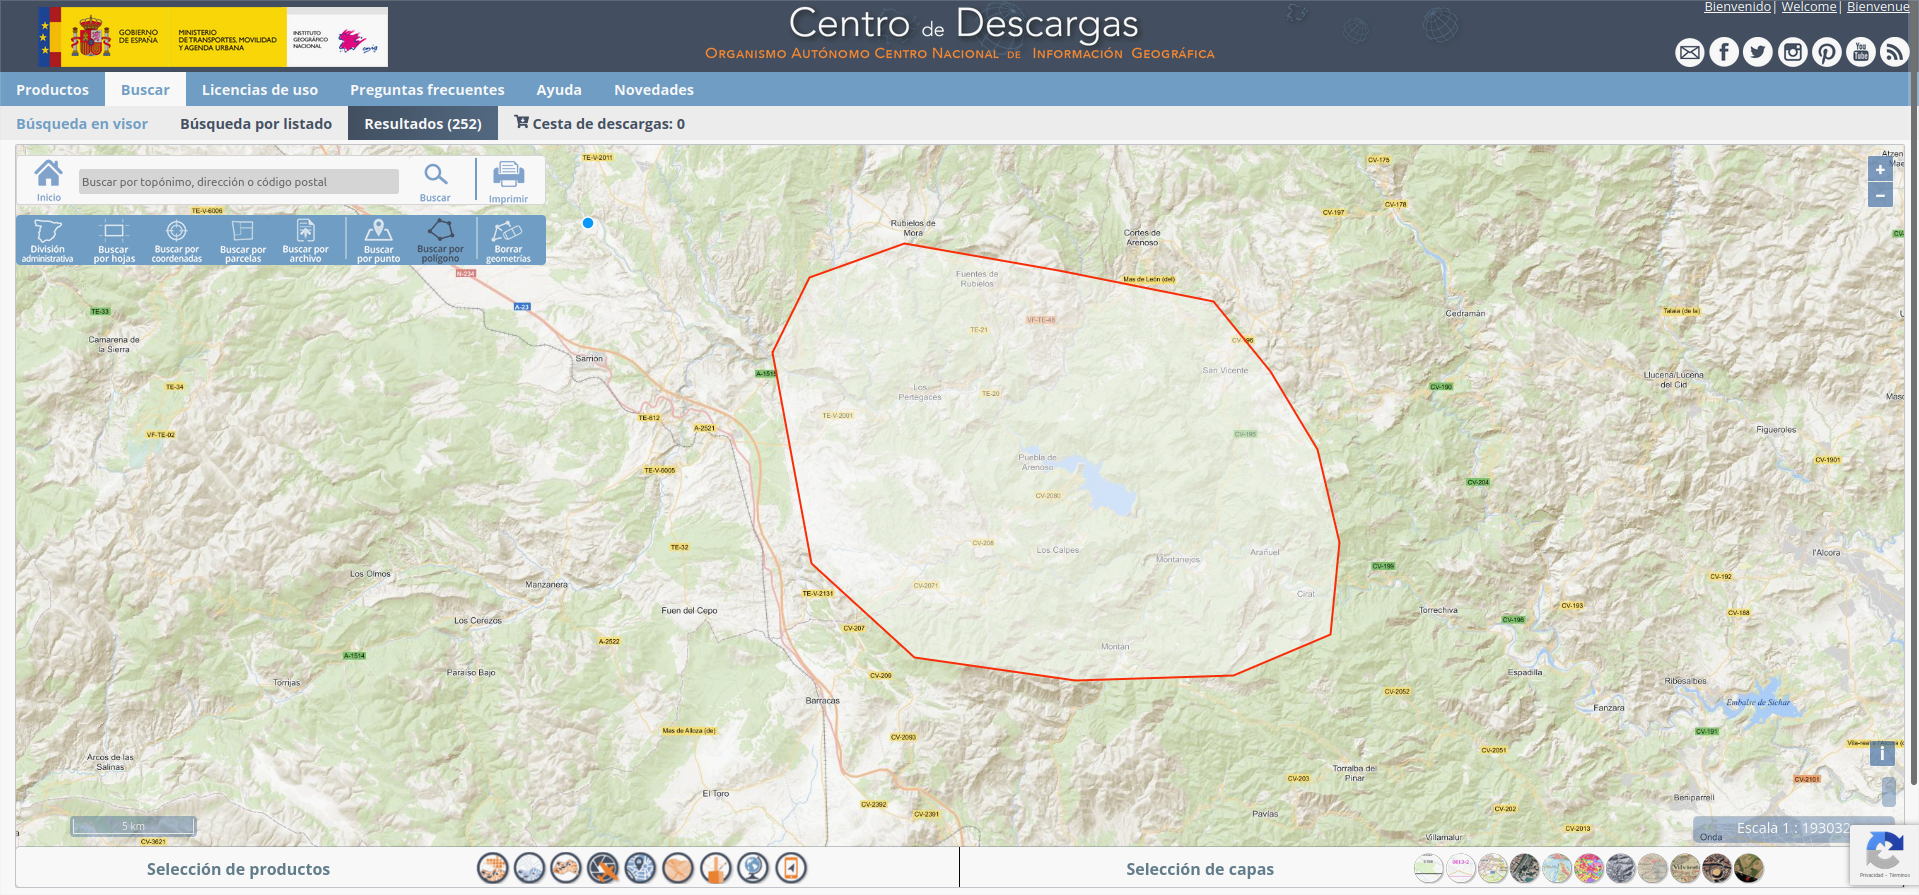
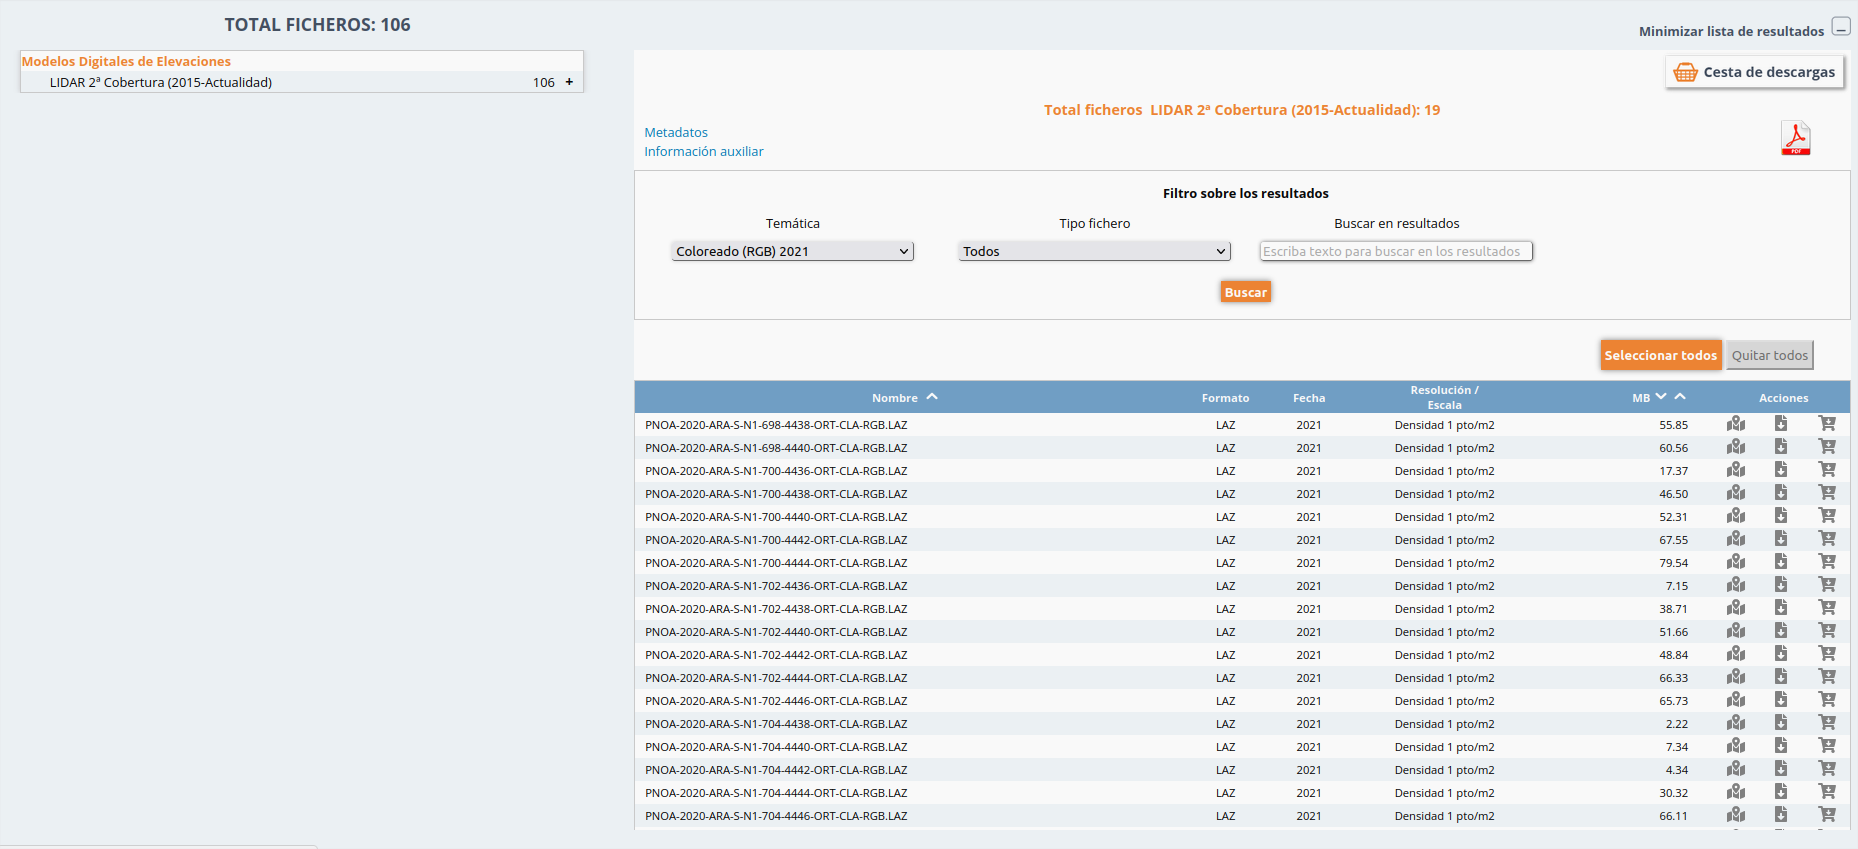
Point cloud
I'll use the awesome public data from the Spanish Geographical Institute (IGN) obtained with survey flights using laser measurements (LIDAR).
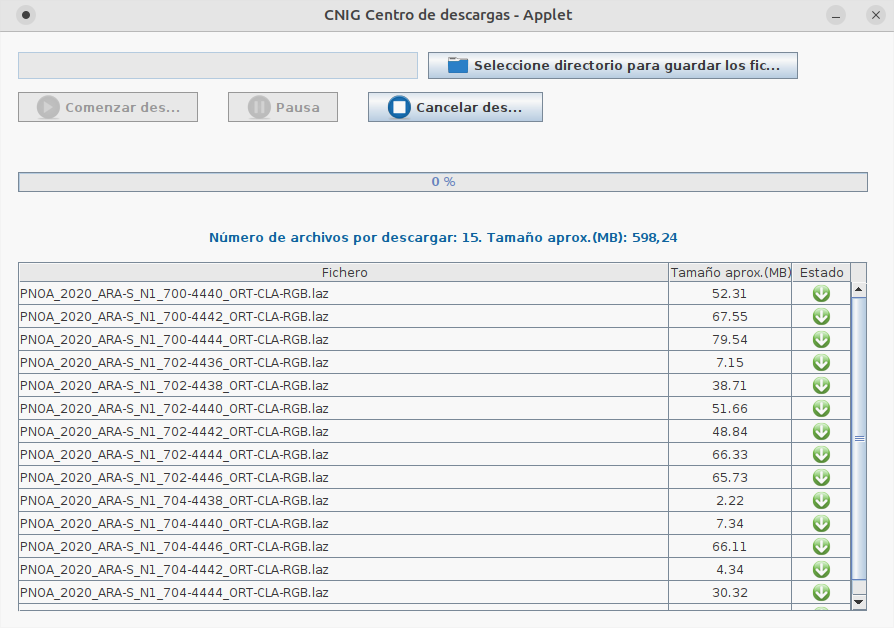
Download the files PNOA-XXXX...XXXX-RGB.LAZ. RGB uses true color; ICR, infra-red. But both are valid.
TIP! Download all files using the IGN applet. It's a .jnlp file that requires Java instaled on Windows or IcedTea on Linux (sudo apt-get install icedtea-netx)
2. Process LIDAR point cloud in QGIS
Direct visualization
From the latest versions (like 3.28 LTR Firenze), QGIS includes compatibility with point cloud files.
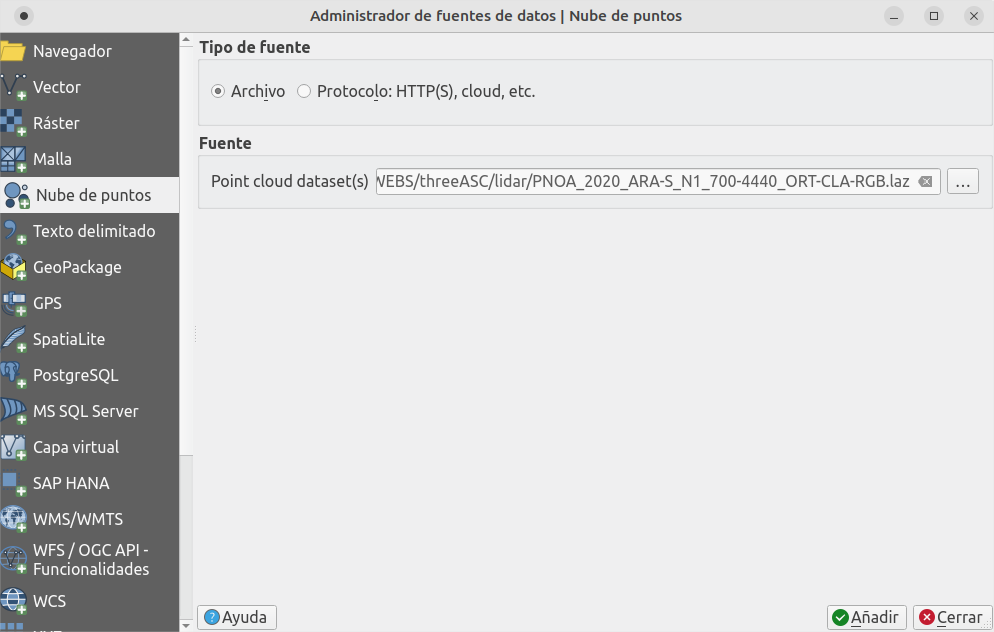
Just drag and drop the file to the canvas or, in the menu, Layer -> Add layer... -> Add point cloud layer...
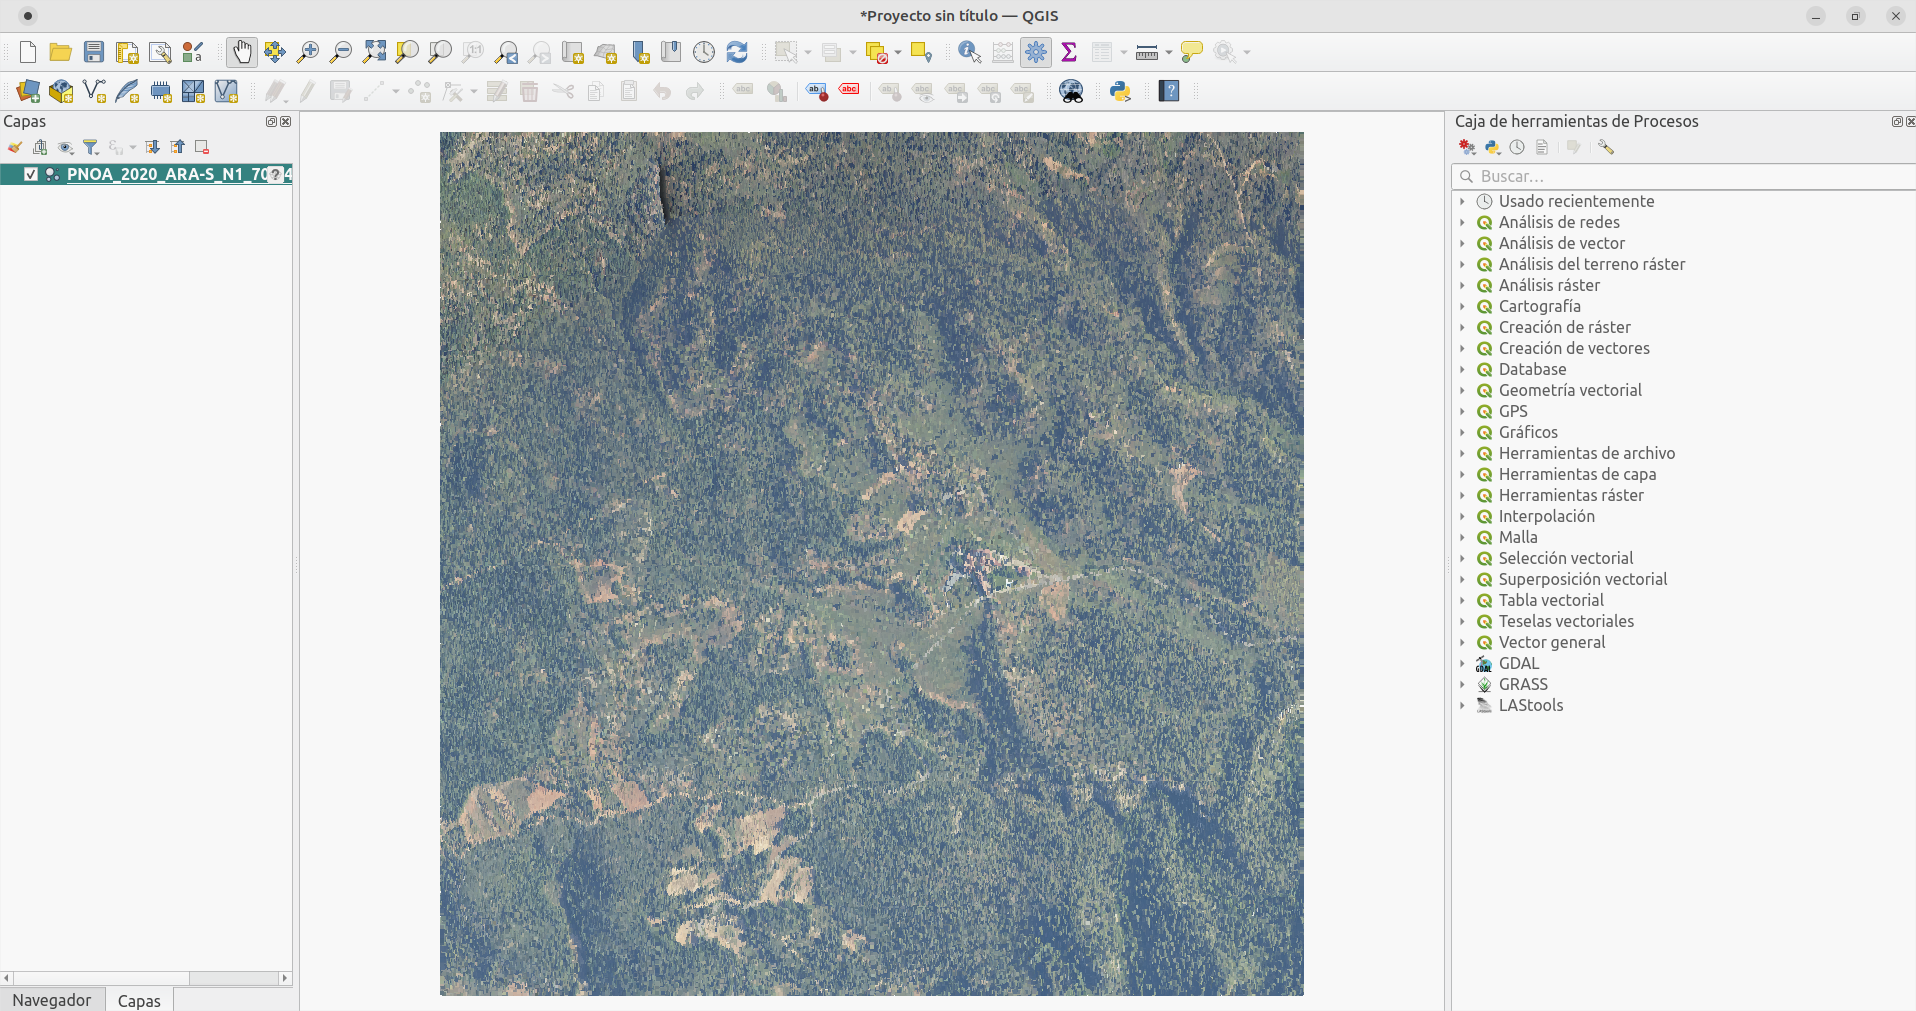
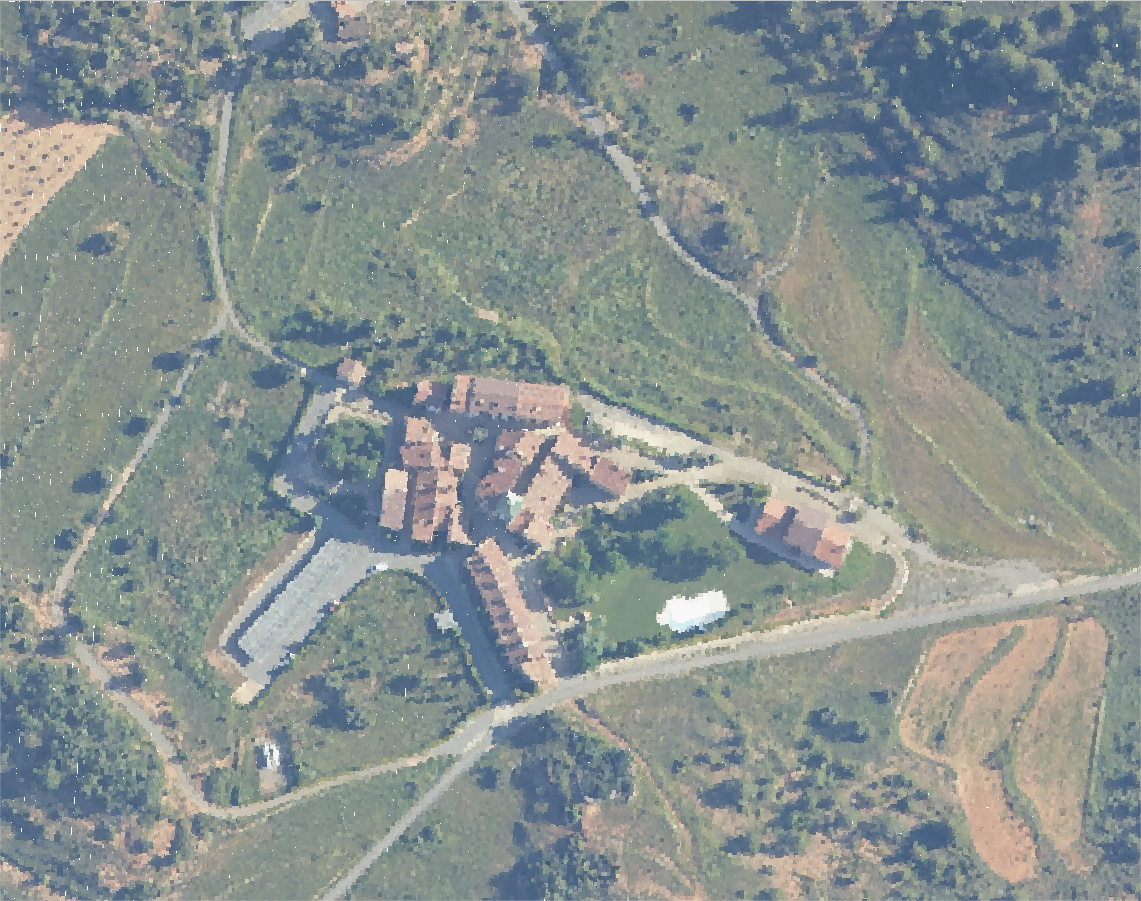
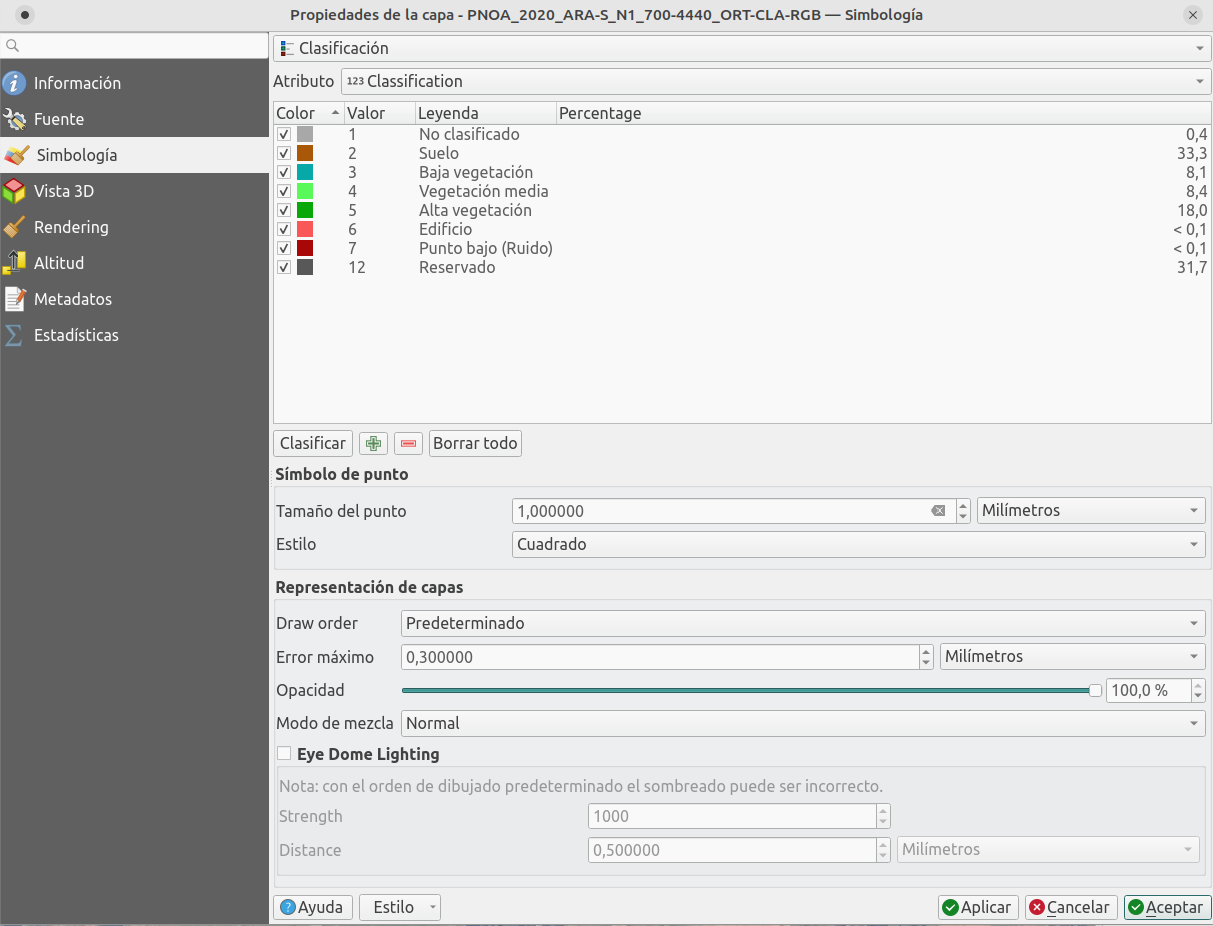
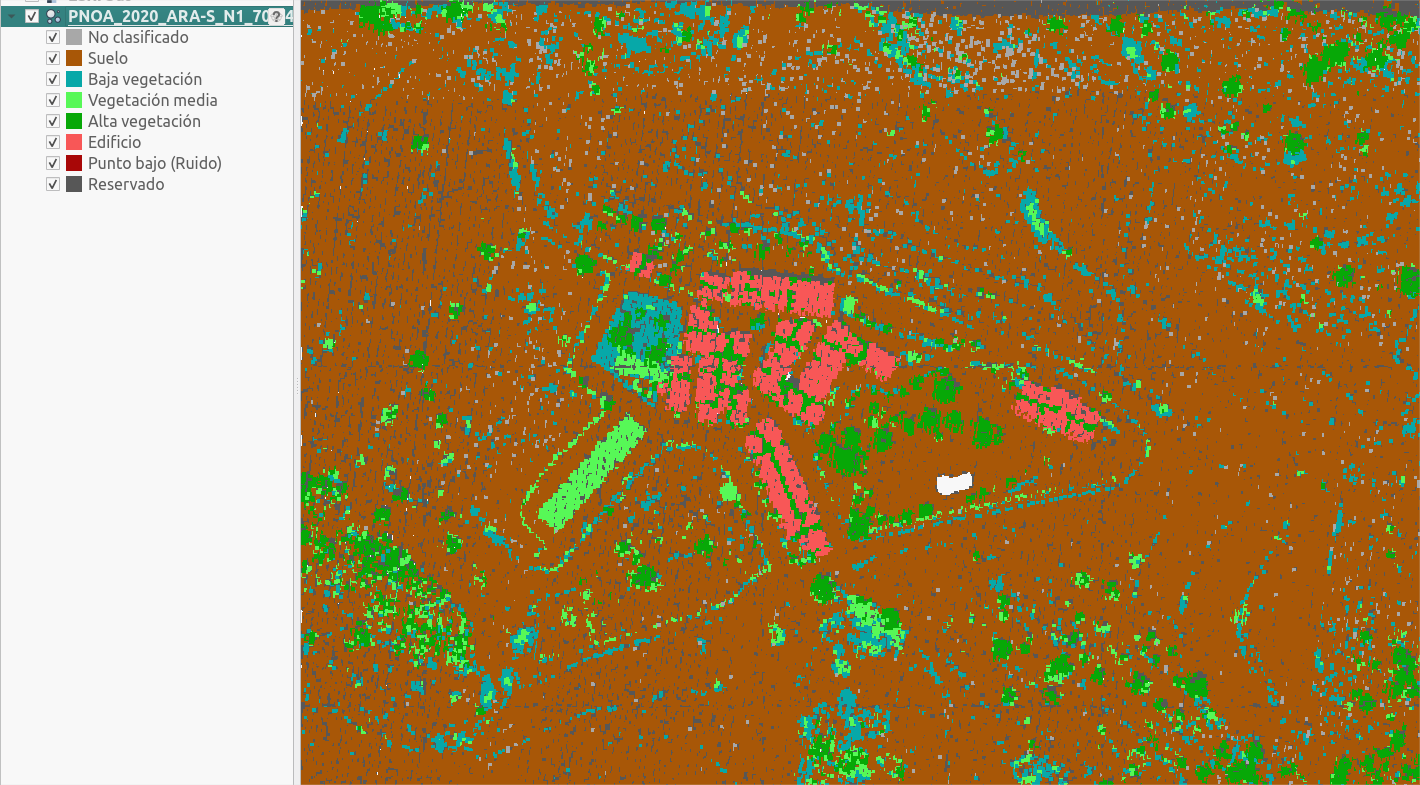
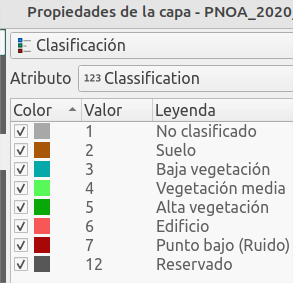
You'll see the true color data downloaded, which you can classify in the SimbologyProperties, choosing Clasification by data type:
3D view
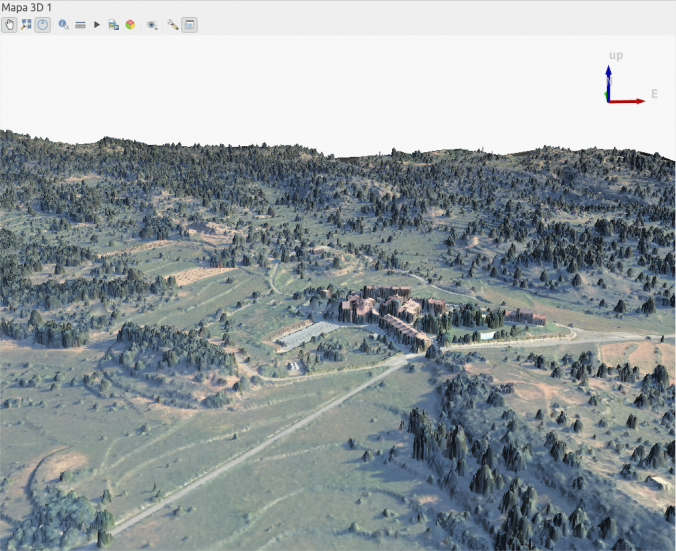
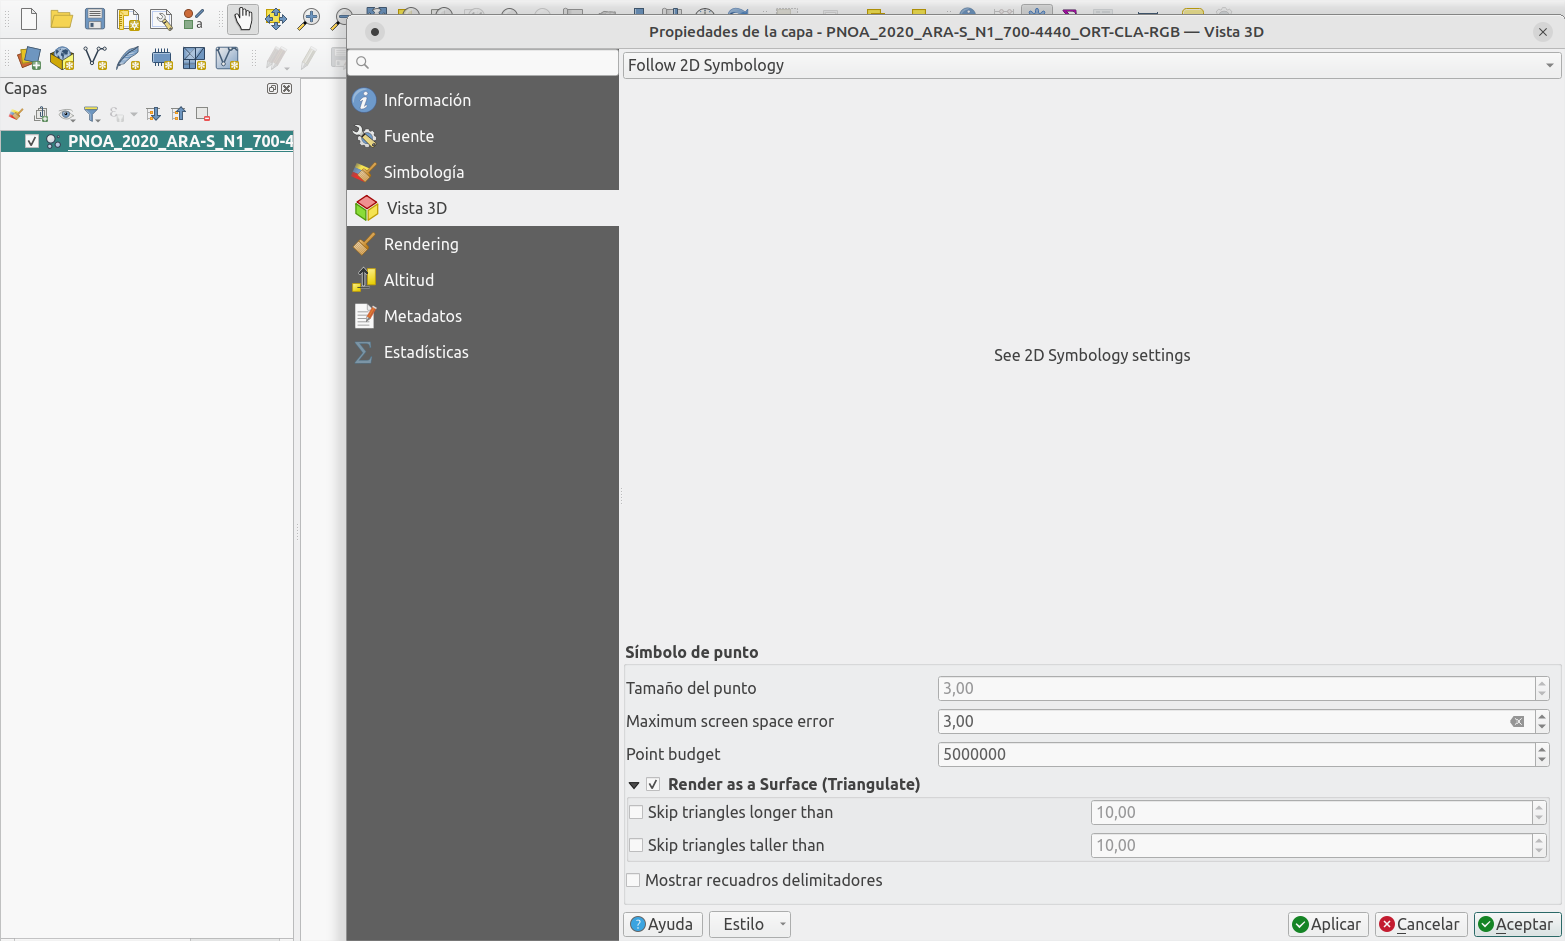
Another default function coming with QGIS is 3D visualization of the information.
Let's configure the 3D properties of the LIDAR layer to triangulate the surface and get a better result.
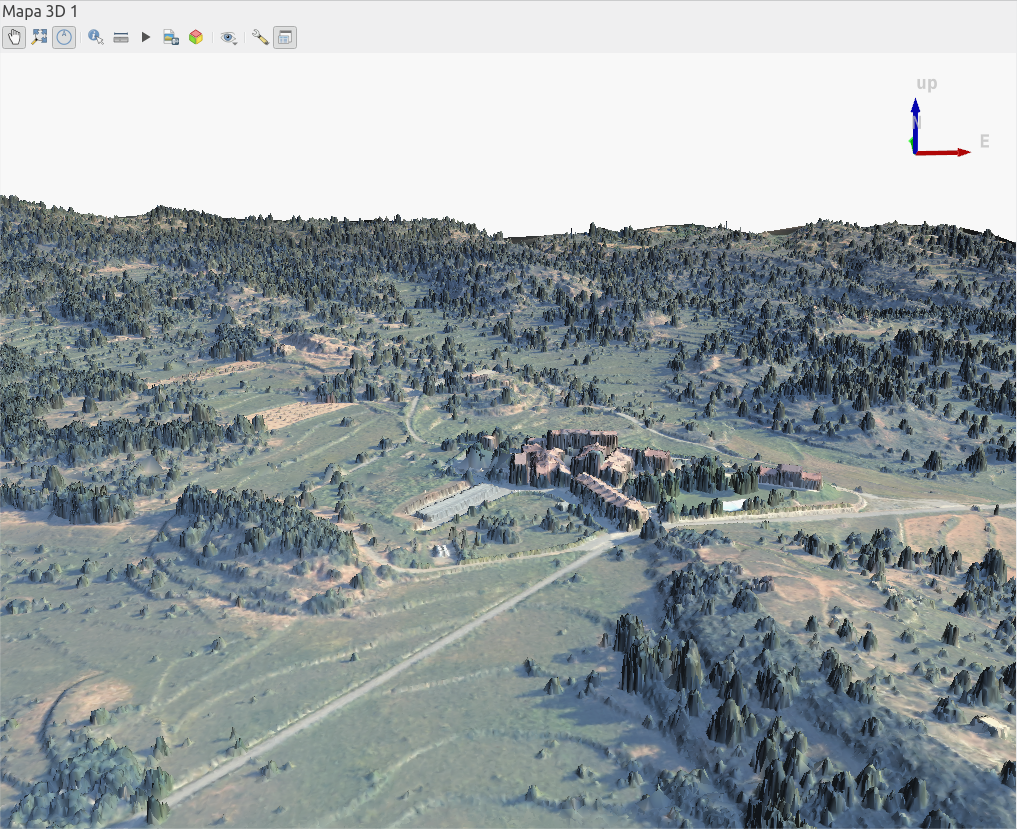
Now, create a new view in the menu View -> 3D Map Views -> New 3D map view. Using SHIFT+Drag you can rotate your perspective.
LAStools plugin
To handle LIDAR information easily we'll use the tools from a plugin called LAStools, which you can install in the following way:
TIP! On Linux it's recommended to install Wine to use the .exe files directly, or otherwise you'll need to compile the binaries.
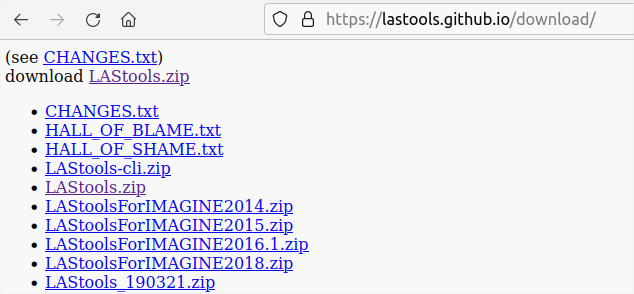
Access LAStools' website and scroll to the bottom:
The full tool comes to a price, but you can access the public download to use the basic functions that we need.
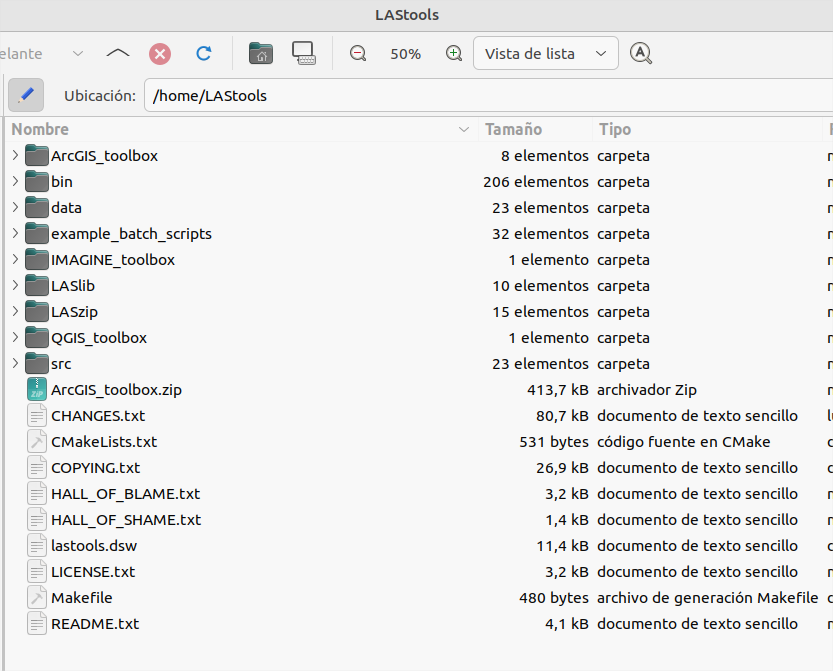
Unzip the compressed .zip file in a simple folder (without spaces or special characters)
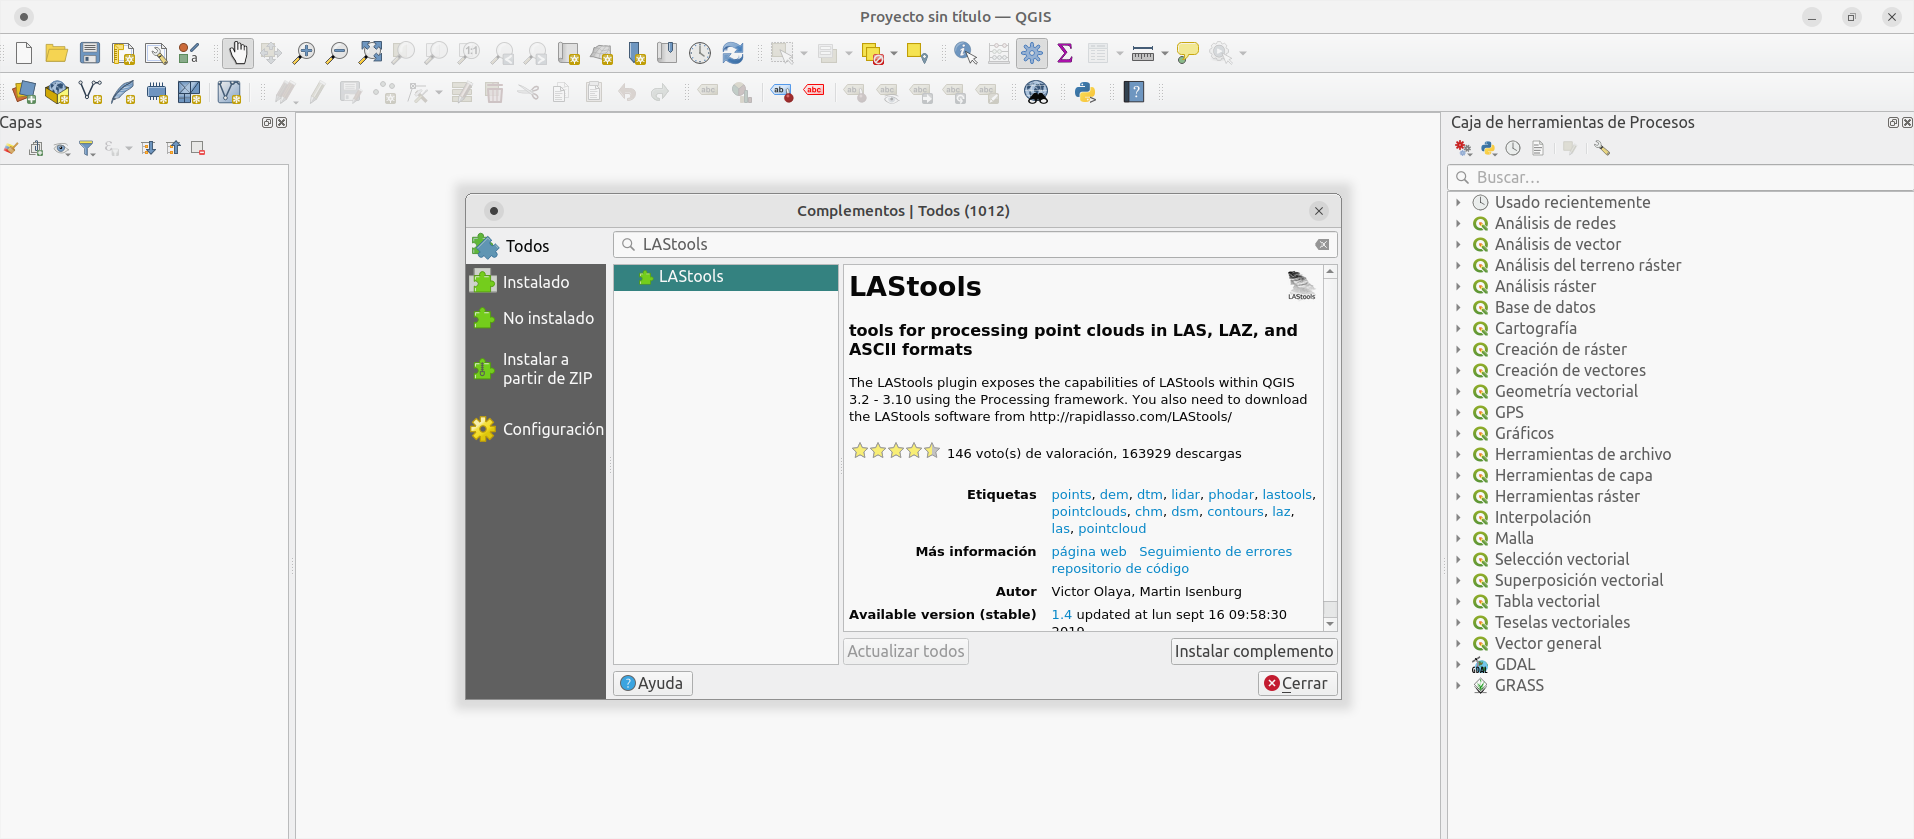
Now open QGIS, search in the plugins list for LAStools and install it.
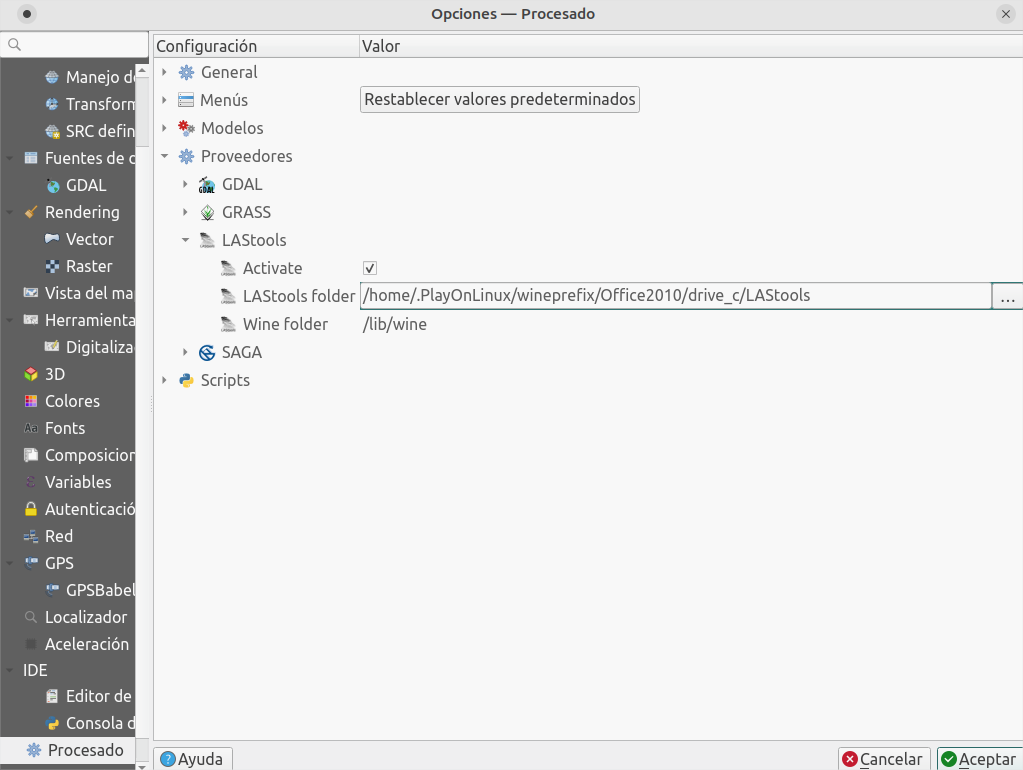
Finally, configure LAStools' installation folder (if it's different from the default C:/ ). The settings shown below work in Linux with Wine installed (using PlayOnLinux in my case).
Extract types of LIDAR data
Using LAStools we can extract information of the different data that makes up the point cloud. For example, we'll only extract the data classified as Suelo (soil) which is assigned to a value of 2.
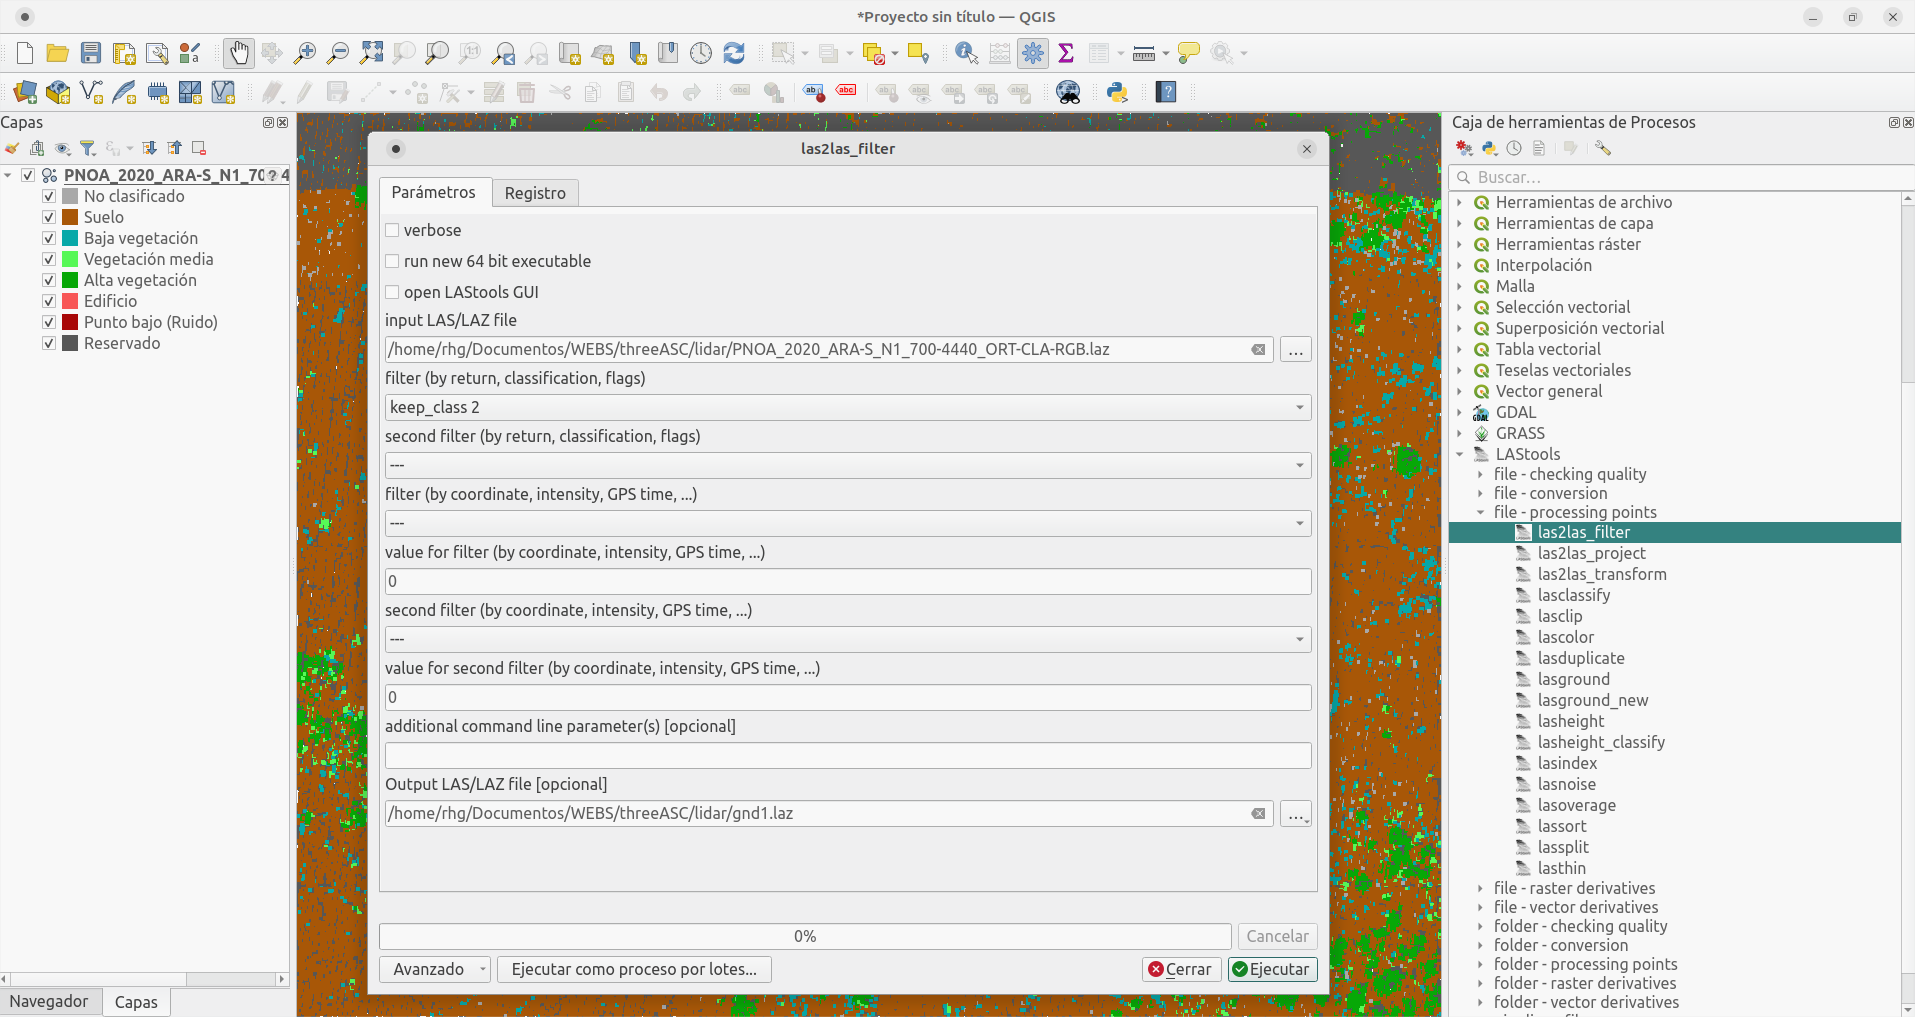
With the process las2las_filter we'll create a filtered point cloud:
Select the .laz file to filter.
On filter, choose the option to keep_class 2
Leave the rest by default, and introduce 0 where the fields require a value
Finally, save the file with .laz extension in a known location to find it easily.
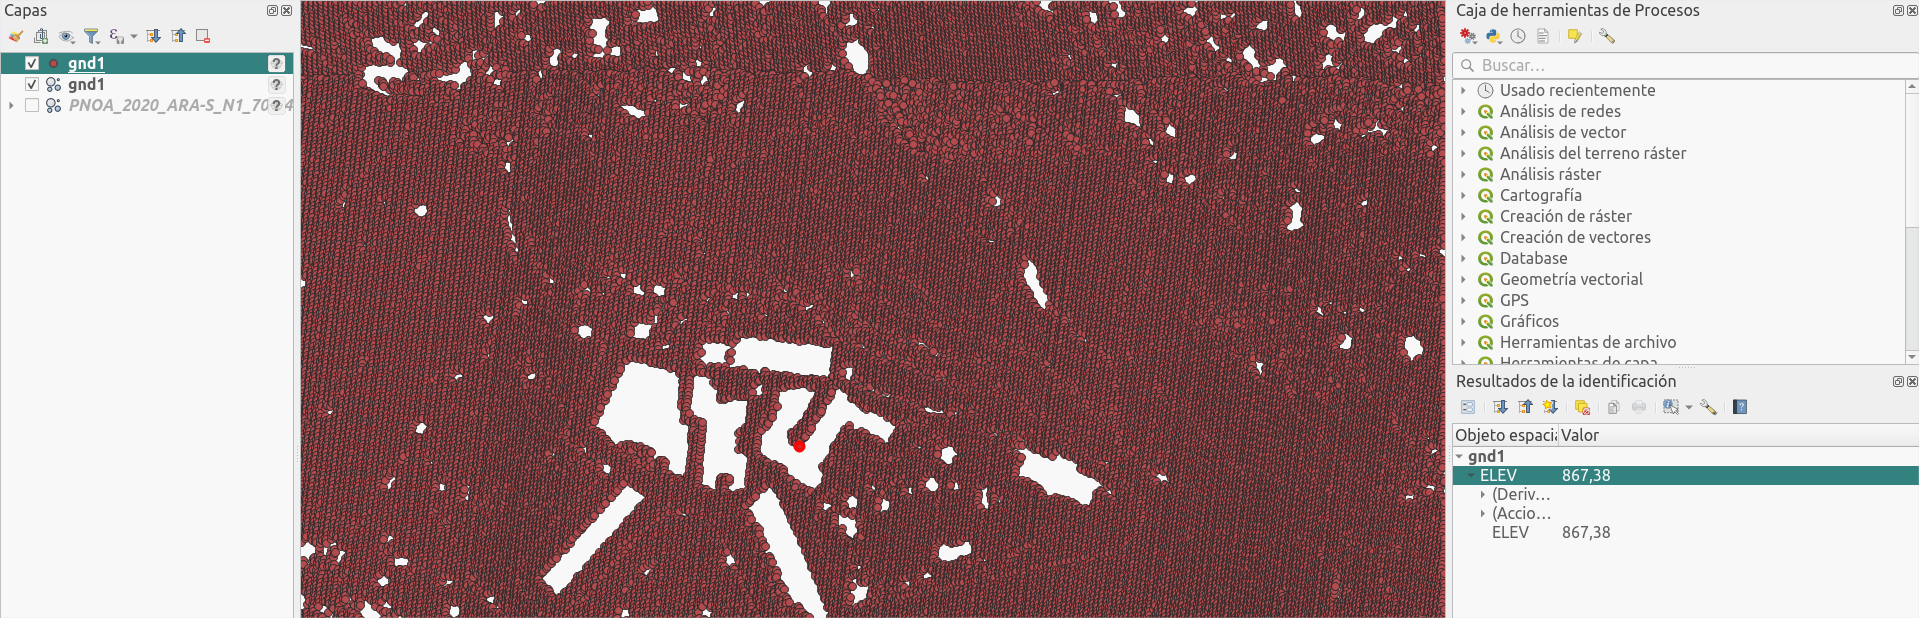
Once finished, just load the generated file and see the point cloud showing only ground data (with buildings and vegetation removed).
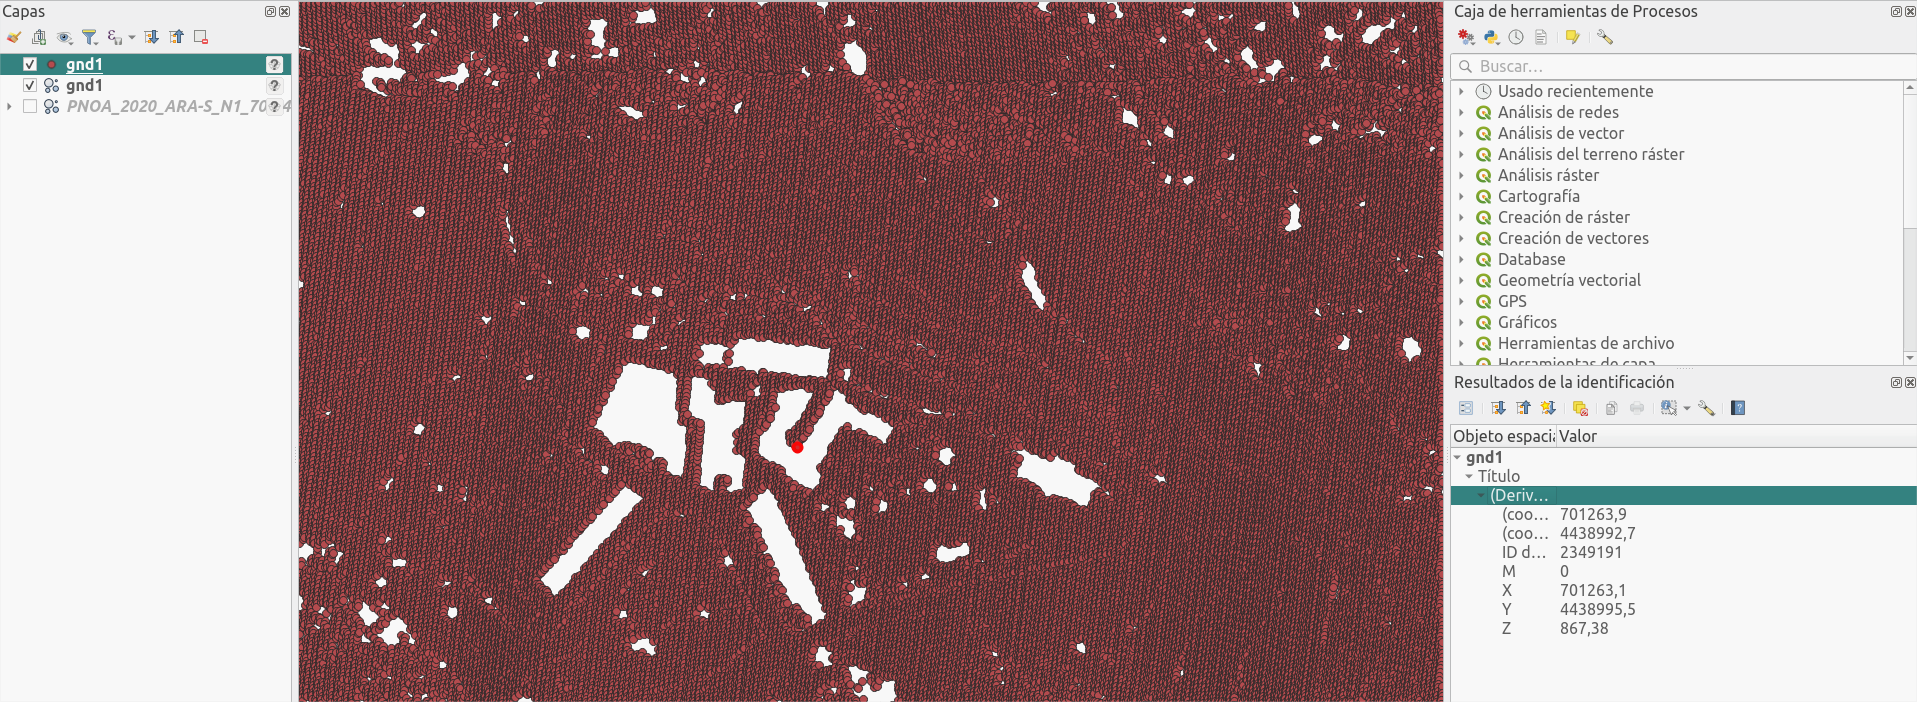
LIDAR to vector conversion
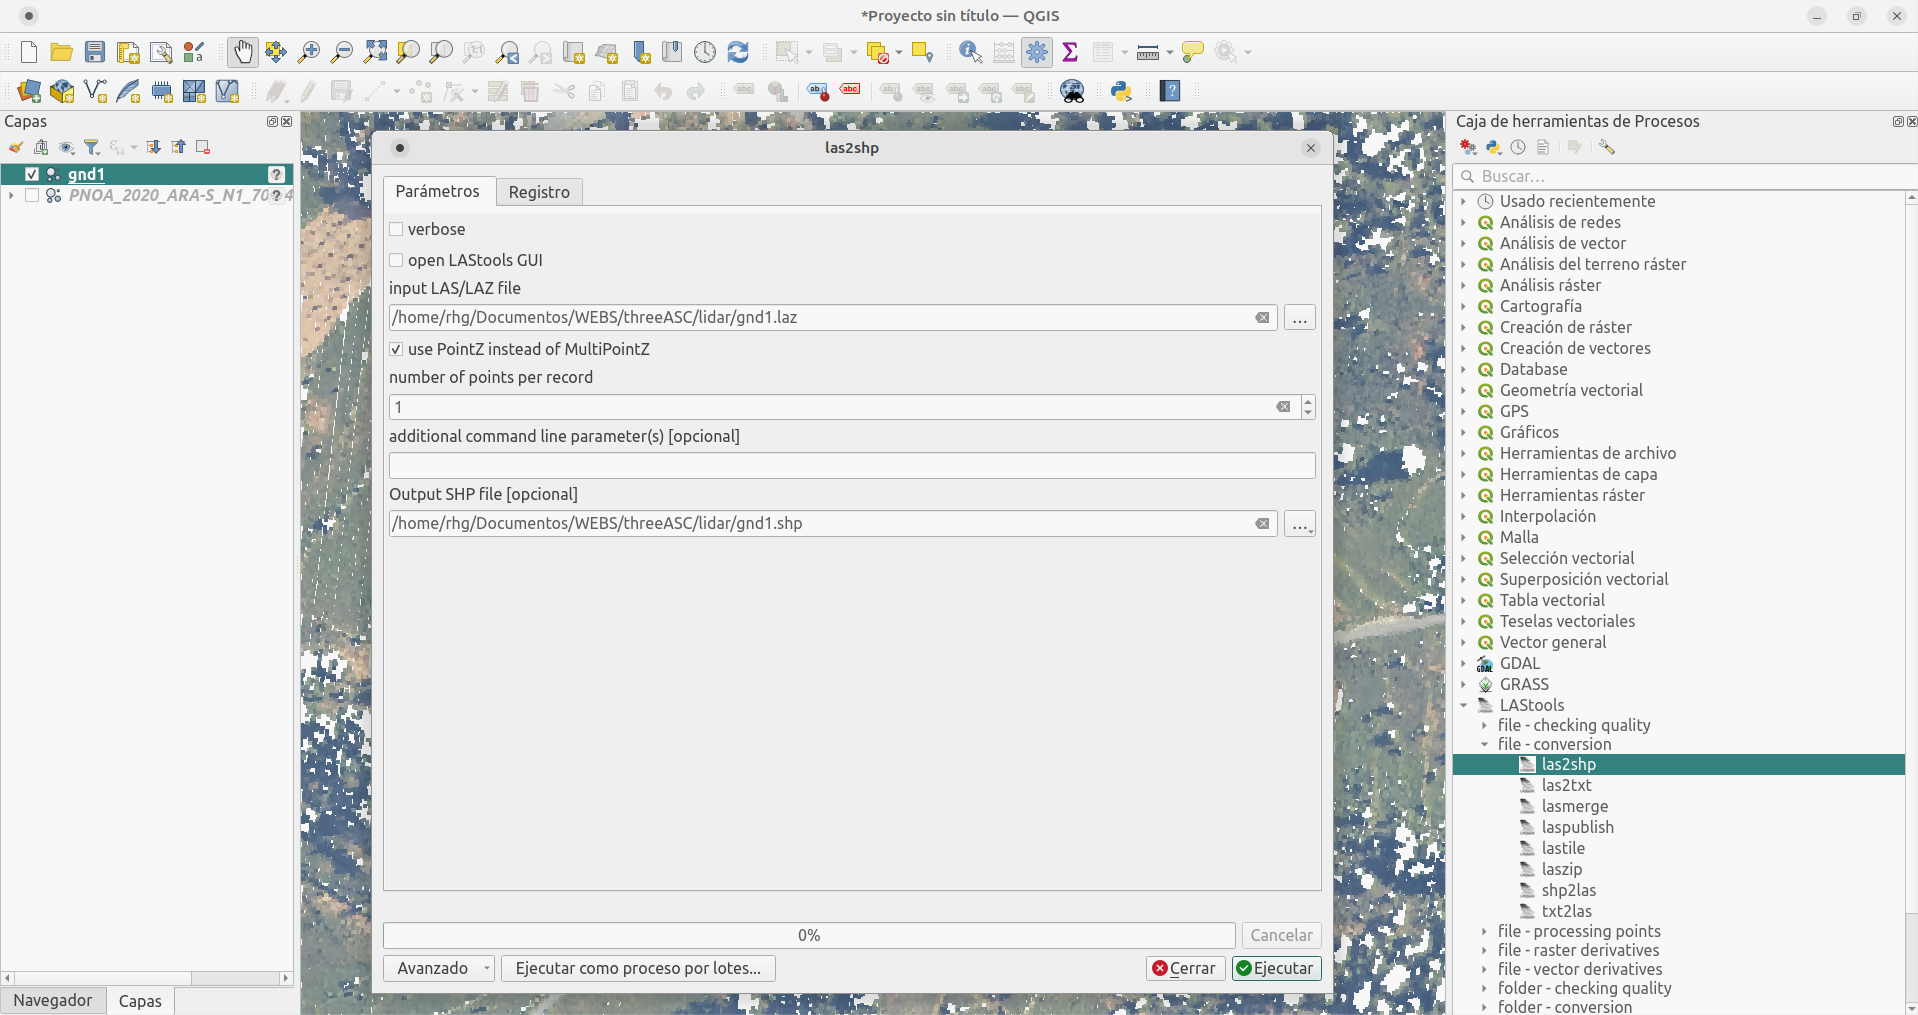
Now use the process las2shp to transform the point cloud into a vector format so you can operate easily with other GIS tools:
Choose the point cloud file just filtered.
Specify 1 point per record to extract every point of the cloud.
Save the file with .shp extension in a known location to find it easily.
And this will be your filtered point cloud in the classic vector format.
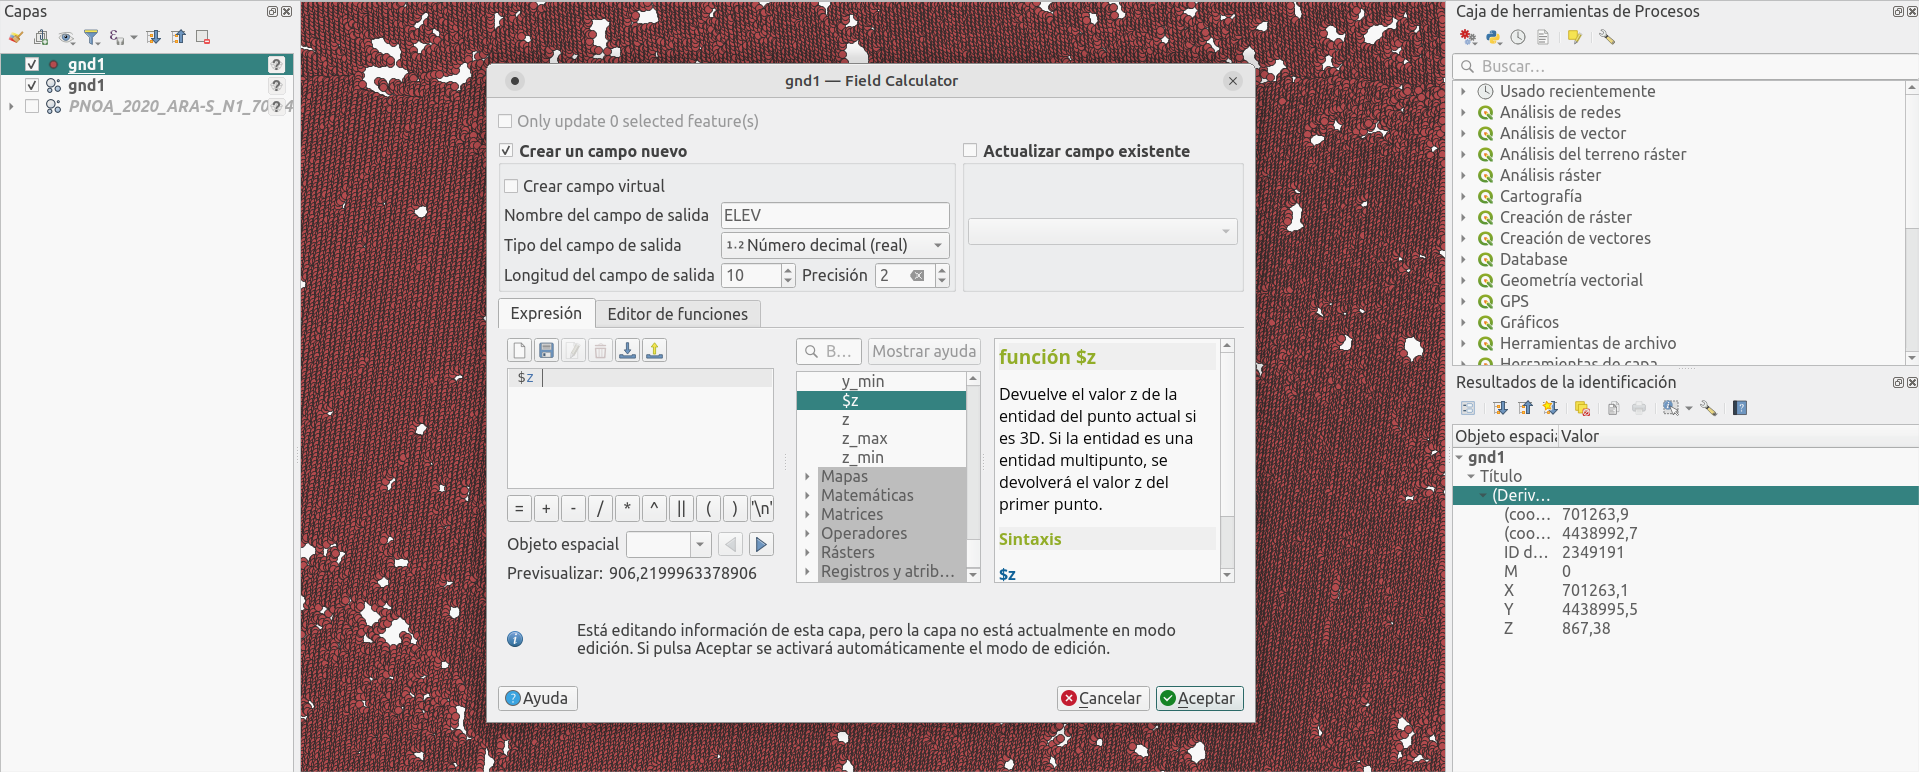
You can see that there is no specific field in the table of attributes. I'll create a new field ELEV to save the Z (height) coordinate and use it to generate a Digital Terrain Model.
3. Digital Terrain Model creation
Raster form vector point layer
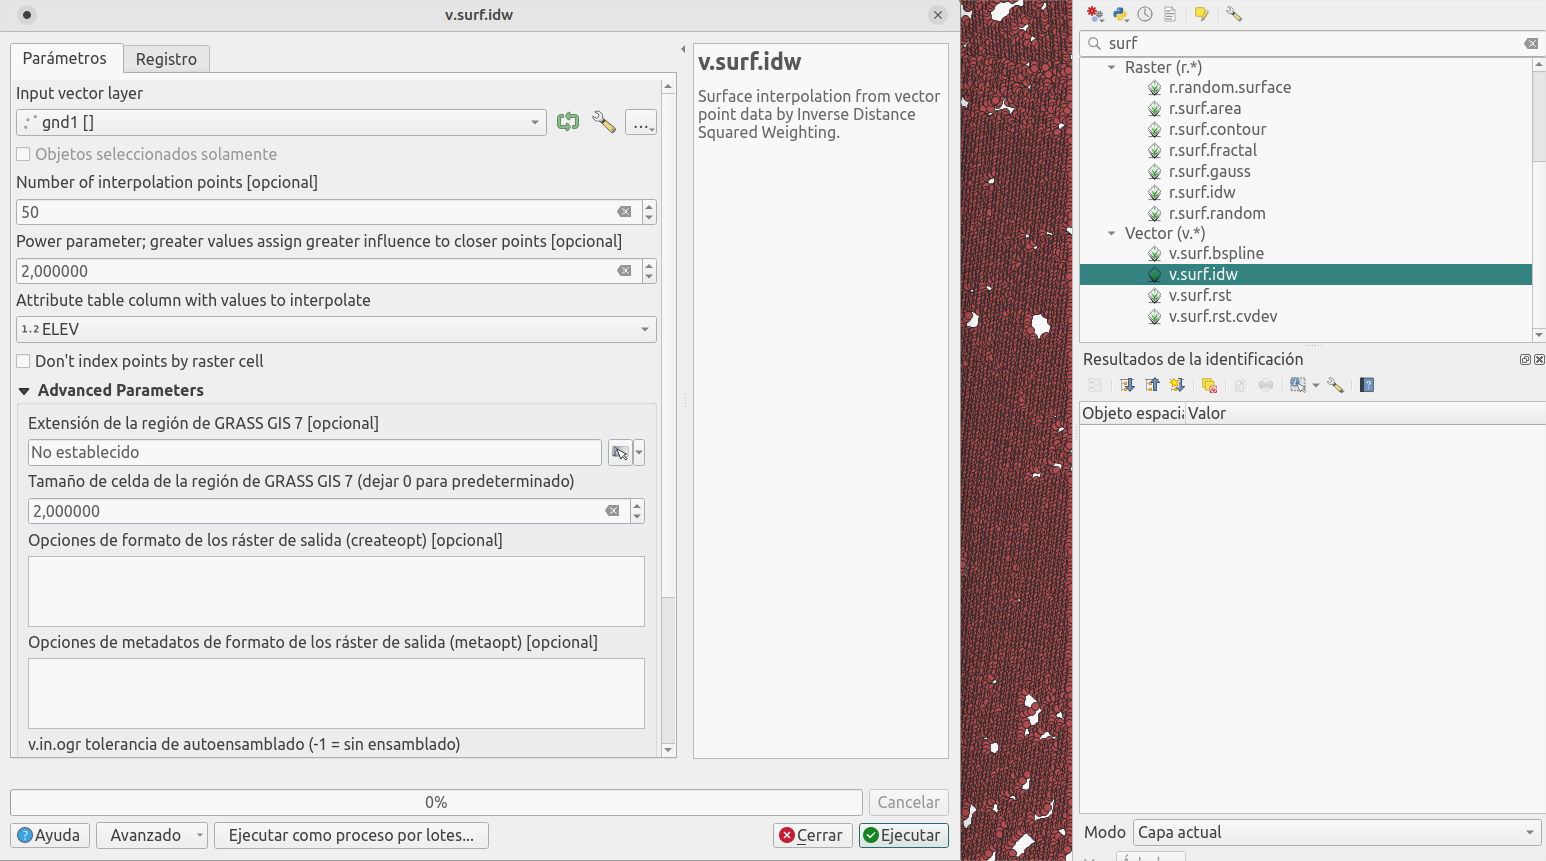
Thanks to the integration of GRASS GIS, we can make use of powerful vector and raster processing tools. Let's use v.surf.idw to generate a regular grid from the interpolation of data in a point layer (in this case the values are weighted with the inverse of the distance but the are other spline algorithms).
Choose the vector point layer.
Choose the number of points to use for interpolation (in this case the data is quite dense so I'll choose 50). The more you choose, the softer the result will be, at the expense of losing the detail of the information density.
Leave the power with the value of 2, to use "square inverse distance".
Choose the data field used in the interpolation (ELEV).
Define the grid cell size. I choose 2 to compare the result with the 2m DTM product from IGN.
4. Result
Let's zoom out and see how it all finished:
RGB LIDAR point cloud2 meter DTM from LIDAR
And now let's see a bit more detail.
Apply the same color ramp to the generated DTM and to the IGN product. Overall, the result is very similar, with some differences in tree areas, being more reasonable in the processed layer.
MDT 2m LIDARMDT 2m IGNLIDAR + SatIGN + Sat
And that's it! Any doubt or comment can be dropped on Twitter!
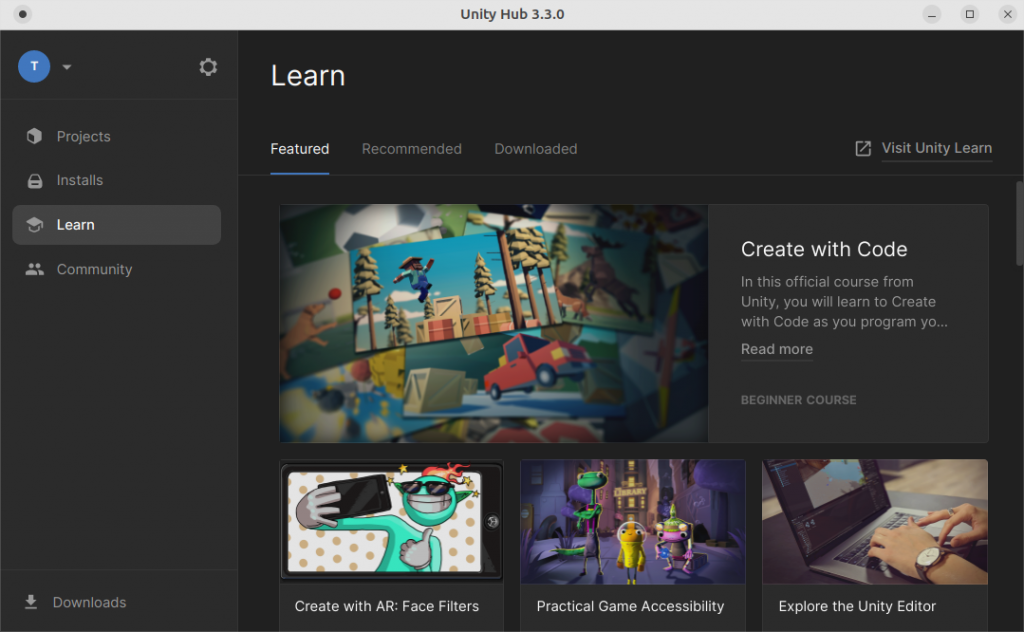
Everything looks fine until you run the program and this happens:
>> unityhub
This error originated either by throwing inside of an async function without a catch block, or by rejecting a promise which was not handled with .catch(). The promise rejected with the reason:
ConnectionLost: Timeout! Cannot connect to Licensing Client within 60000ms
    at Function.fromType (/opt/unityhub/resources/app.asar/node_modules/@licensing/licensing-sdk/lib/core/ipc/licensingIpc.js:51:16)
    ...
Luckily, surfing the web you usually find the solution, and this one was in the same Unity forum:
Following the official steps from their site (first link in the post):
Add the Unity repository to your sources list: sudo sh -c 'echo "deb https://hub.unity3d.com/linux/repos/deb stable main" > /etc/apt/sources.list.d/unityhub.list'
Add the public key to make it trustful: wget -qO - https://hub.unity3d.com/linux/keys/public | sudo apt-key add -
Update your repositories: sudo apt update
Install UnityHub: sudo apt-get install unityhub
It should all go fine, despite an error with some “chrome-sandbox” folder. But that’s not the error. Running unityhub from the terminal we have the above error.
Installing libssl1.1
The problem is that Ubuntu 22 uses a more recent version of libssl package, but we can still download the version used by Ubuntu 20.
I was writing a post where I wanted to insert a 3D model to picture it better, and I even thought in doing a viewer myself. But I didn’t have to browse long to find Three.js.
Let's keep with the example and fill up the second <script> block defining a scene with an animated rotating cube:
<script type="module">
        import * as THREE from 'three';
	const scene = new THREE.Scene();
	const camera = new THREE.PerspectiveCamera( 75, window.innerWidth / window.innerHeight, 0.1, 1000 );

	const renderer = new THREE.WebGLRenderer();
	renderer.setSize( window.innerWidth, window.innerHeight );
	document.body.appendChild( renderer.domElement );

	const geometry = new THREE.BoxGeometry( 1, 1, 1 );
	const material = new THREE.MeshBasicMaterial( { color: 0x00ff00 } );
	const cube = new THREE.Mesh( geometry, material );
	scene.add( cube );

	camera.position.z = 5;

	function animate() {
		requestAnimationFrame( animate );

		cube.rotation.x += 0.01;
		cube.rotation.y += 0.01;

		renderer.render( scene, camera );
	};

	animate();
</script>
All of this would look like this:
Add drag controls and background
Now we have a base to work with. We can add some functionality inserting the OrbitControls module.
//Import new modules at the beginning of the script
import { OrbitControls } from 'https://unpkg.com/[email protected]/examples/jsm/controls/OrbitControls.js';

//then add the mouse controls after declaring the camera and renderer
const controls = new OrbitControls( camera, renderer.domElement );
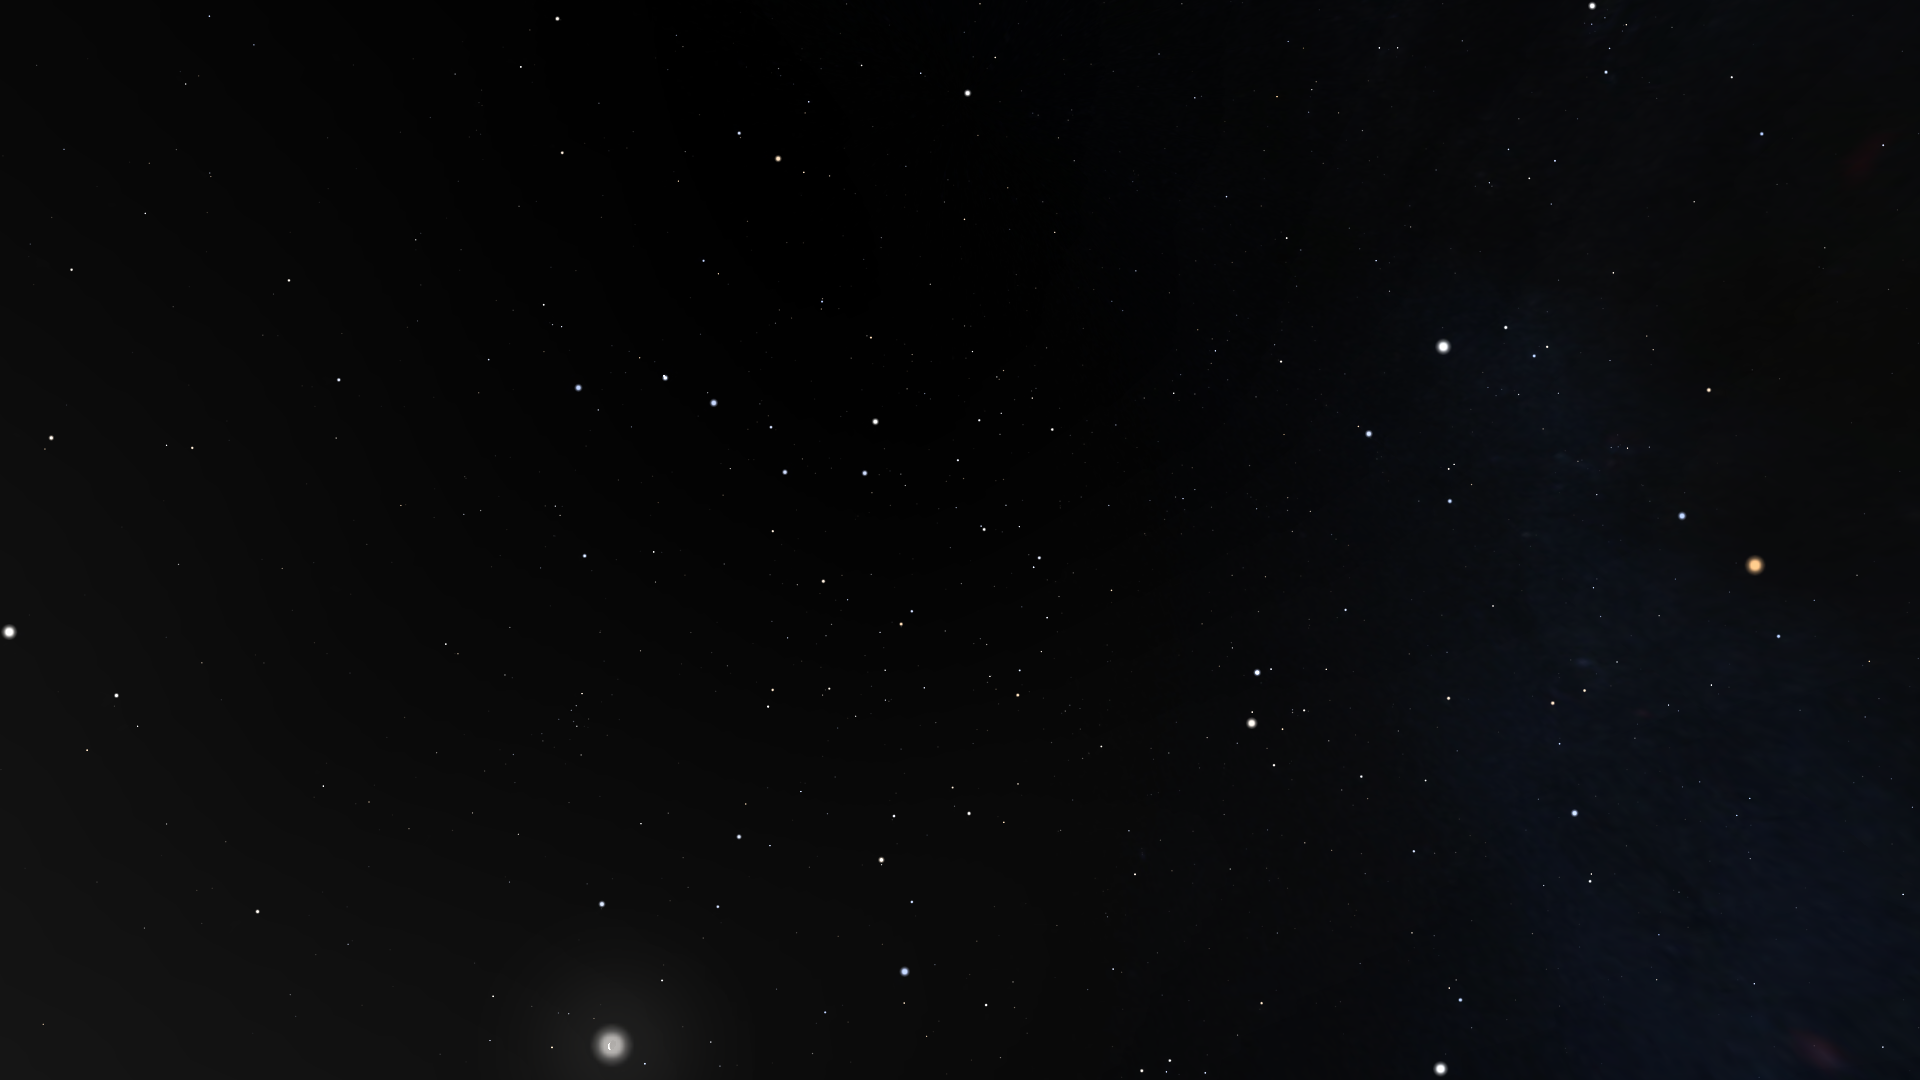
Also, you can modify the background easily, but you will need to host your images within your app in a server, or run it locally, because of CORS. I will be using the background image of the blog header, which was taken from Stellarium.
First define a texture. Then, add it to the scene:
//do this before rendering, while defining the scene
//define texture
const texture = new THREE.TextureLoader().load( "https://theroamingworkshop.cloud/demos/Unity1-north.png" );

//add texture to scene
scene.background=texture;
Full code:
<!DOCTYPE html>
<html>
	<head>
		<meta charset="utf-8">
		<title>My first three.js app</title>
		<style>
			body { margin: 0; }
		</style>
	</head>
	<body>
        <script async src="https://unpkg.com/[email protected]/dist/es-module-shims.js"></script>

        <script type="importmap">
          {
            "imports": {
              "three": "https://unpkg.com/[email protected]/build/three.module.js"
            }
          }
        </script>
<body style="margin: 0; width:100%;height:300px;">
        <script async src="https://unpkg.com/[email protected]/dist/es-module-shims.js"></script>

        <script type="importmap">
          {
            "imports": {
              "three": "https://unpkg.com/[email protected]/build/three.module.js"
            }
          }
        </script>

    <script type="module">

    import * as THREE from 'three';
	import { OrbitControls } from 'https://unpkg.com/[email protected]/examples/jsm/controls/OrbitControls.js';

	const scene = new THREE.Scene();

	const texture = new THREE.TextureLoader().load( "https://theroamingworkshop.cloud/demos/Unity1-north.png" );
	scene.background=texture;

    const camera = new THREE.PerspectiveCamera( 75, window.innerWidth / window.innerHeight, 0.1, 1000 );

	const renderer = new THREE.WebGLRenderer();
	renderer.setSize( window.innerWidth, window.innerHeight );
	document.body.appendChild( renderer.domElement );

    const controls = new OrbitControls( camera, renderer.domElement );

	const geometry = new THREE.BoxGeometry( 1, 1, 1 );
	const material = new THREE.MeshBasicMaterial( { color: 0x00ff00 } );
	const cube = new THREE.Mesh( geometry, material );
	scene.add( cube );

	camera.position.z = 5;

	function animate() {
		requestAnimationFrame( animate );

		cube.rotation.x += 0.01;
		cube.rotation.y += 0.01;

		renderer.render( scene, camera );
	};

	animate();
</script>
</body>
</html>
Insert a 3D model
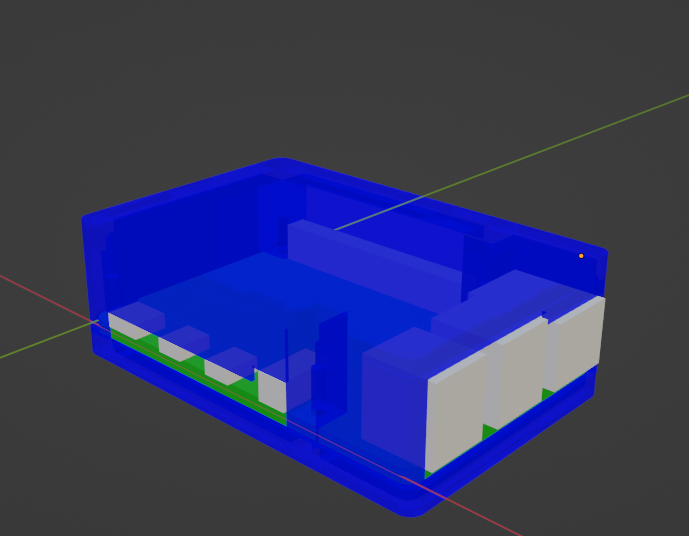
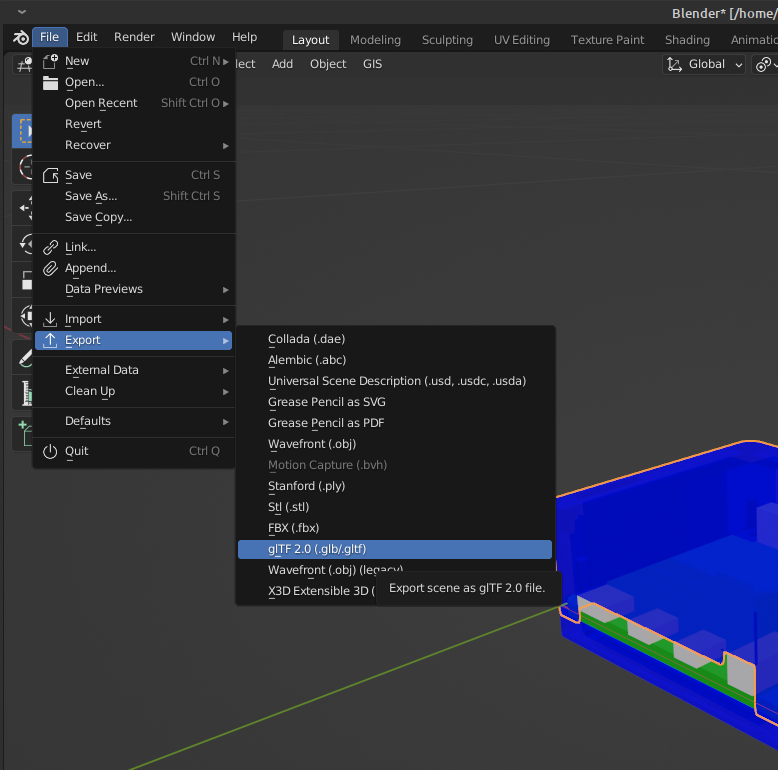
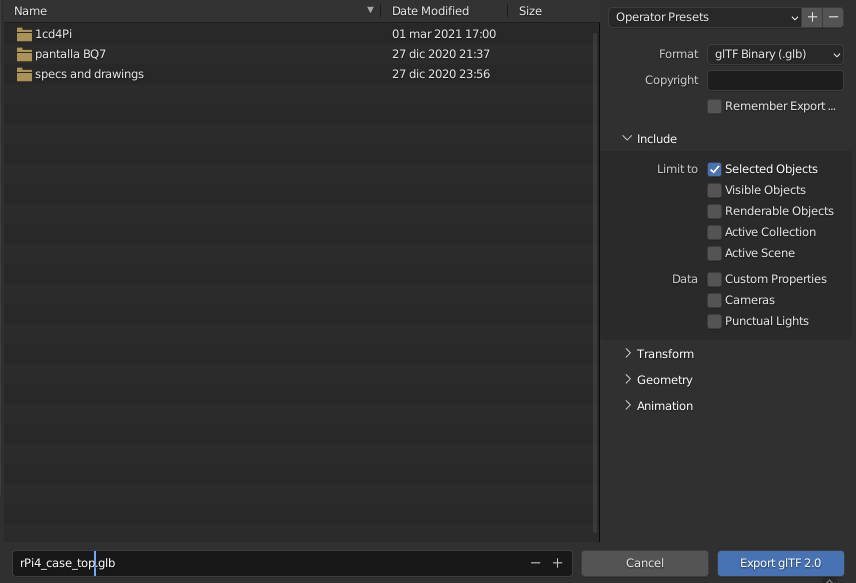
Now let's replace the cube for our own 3D model which, in the case of Three.js, will be a glTF (.GLB o .GLTF) format, that is most supported and renders faster (.fbx, .stl, .obj and so on are also supported).
I will export a .glb of this basic Raspberry Pi 4B case that I did some time ago using Blender:
Now, replace the <script> block based on the "webgl_loader_gltf" which was shown at the start of the post:
Blender is (to me), the top free 3D modelling software. It’s got a huge community, tones of documentation, tutorials and, overall, continuous updates and improvement.
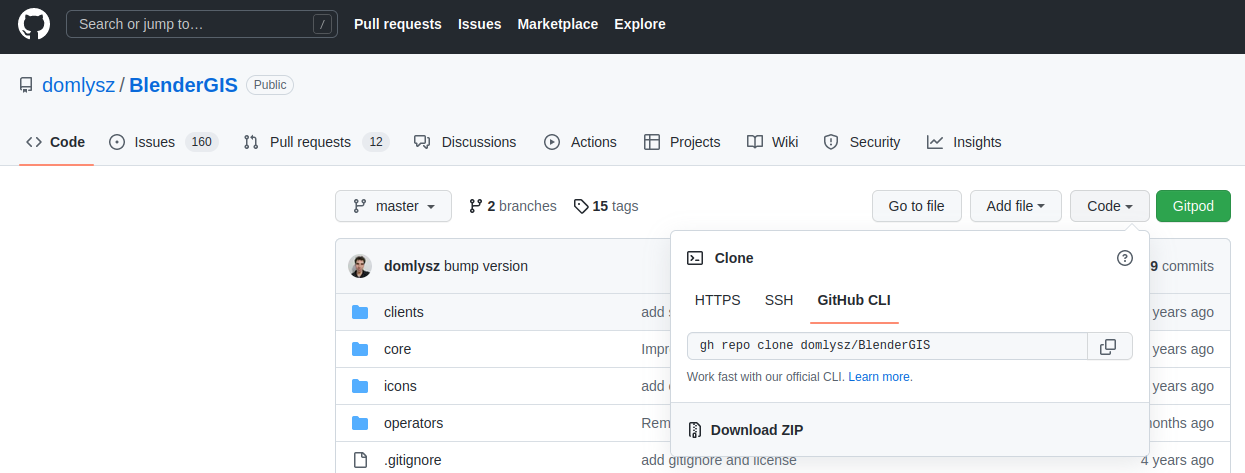
One of the most useful tools is BlenderGIS, an external plugin that lets us drop geographical data, georeferenced or not, and model with them.
Let’s see a use case with an elevation model.
Content
Installation
First thing to do is to download and install Blender from an official source (their website) or from our OS app store:
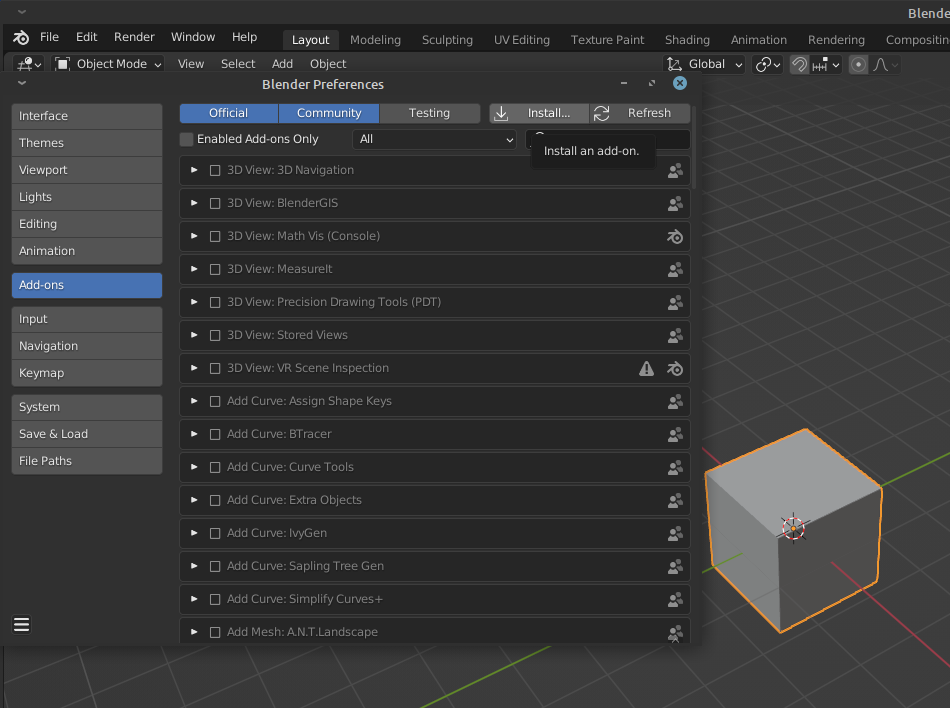
Let's now start Blender and open Add-ons settings (Edit > Preferences > Add-ons).
Press "Install..." and select the BlenderGIS .zip file.
Now you can search it and activate it.
You'll see there's a new "GIS" option in Blender's top bar.
Download geographical information
In this example I will use a Digital Terrain Model in ASCII format (.asc), as it is one of the working formats for BlenderGIS and also the standard for my download source.
If the information you download is in another format, like .tiff or .xyz, you can convert it using some software like QGIS or ArcGIS.
MDT
In my case, I will use MDT200 from spanish IGN, a terrain model with 200m cell size, as I want to show quite a large area that includes the province of Álava.
We can also use an orthophoto as a terrain texture. For this, I will be using QGIS and I will load a WMS also from IGN so I can clip the satellite image exactly to the terrain tile extent.
Load the orthophoto and the terrain layers, then export the orthophoto layer as a rendered image and set the extension from the terrain layer. I will set the cell size to 20 meters (although the imagery allows up to 20cm cell size, which would result in a huge file; the 20m image is already 140MB).
TIP! One way to optimize detail is to generate a grid of smaller size images but higher resolution.
Modelling in Blender
Now it's all ready for Blender.
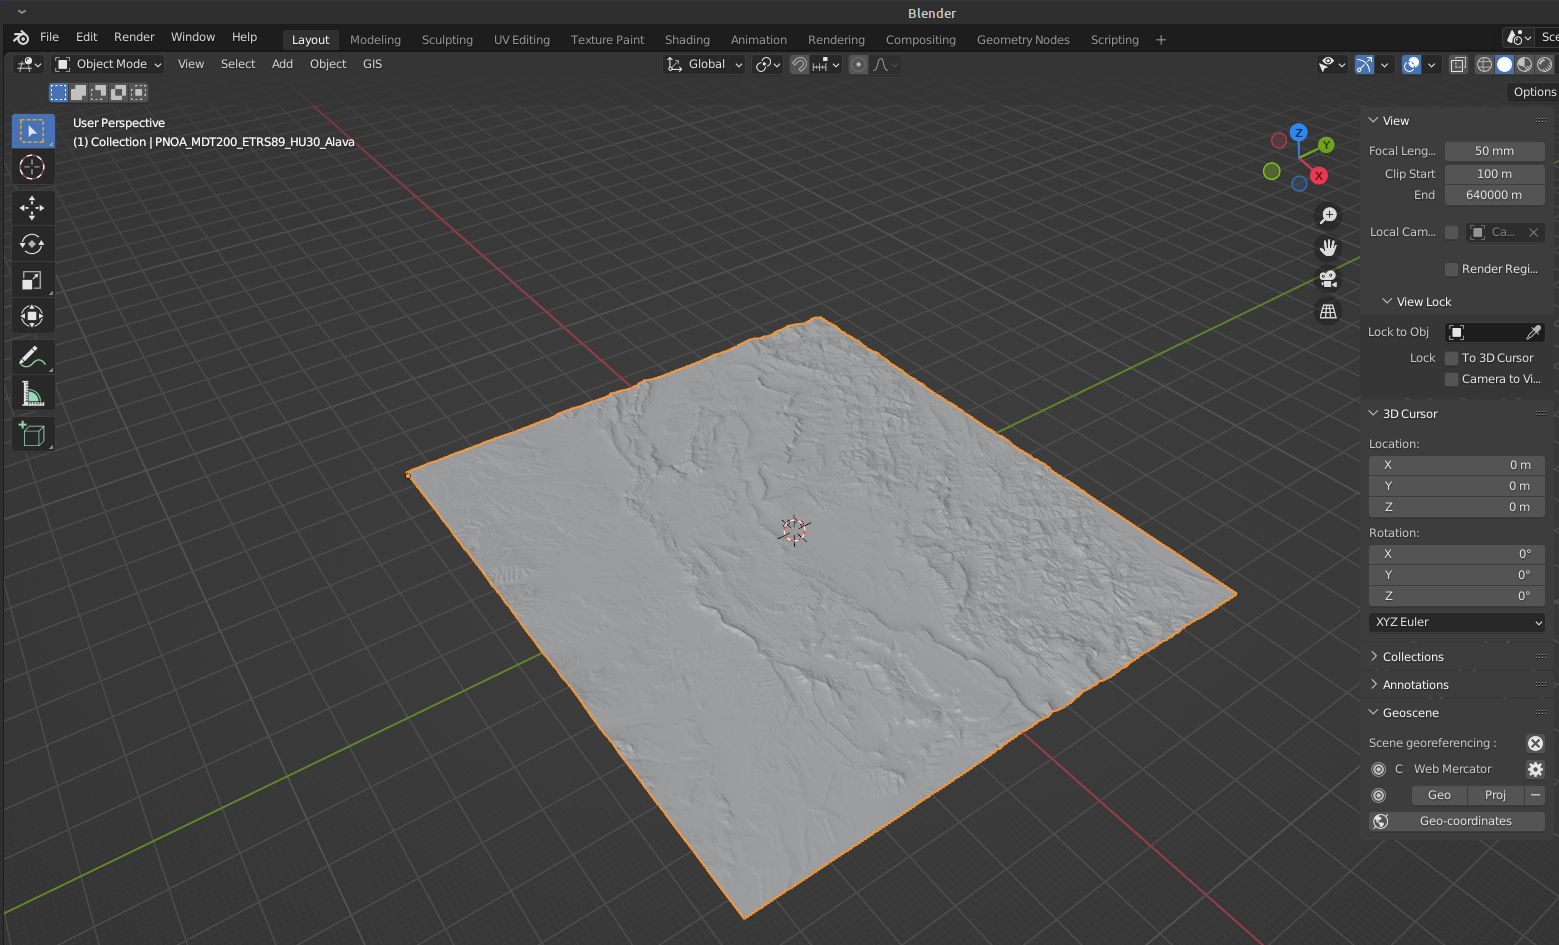
Using the "GIS" menu, import the terrain layers as an ASC grid. You'll see it quickly shows up on screen.
TIP! This model is centered in coordinate origin, but you can georeference the model setting a CRS in the "Geoscene" properties.
Let's add the satellite image:
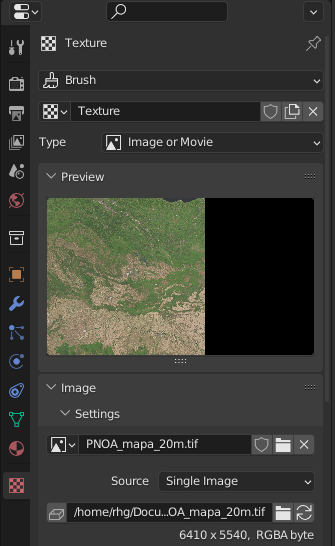
Create a new material.
Create a new texture and load the satellite image.
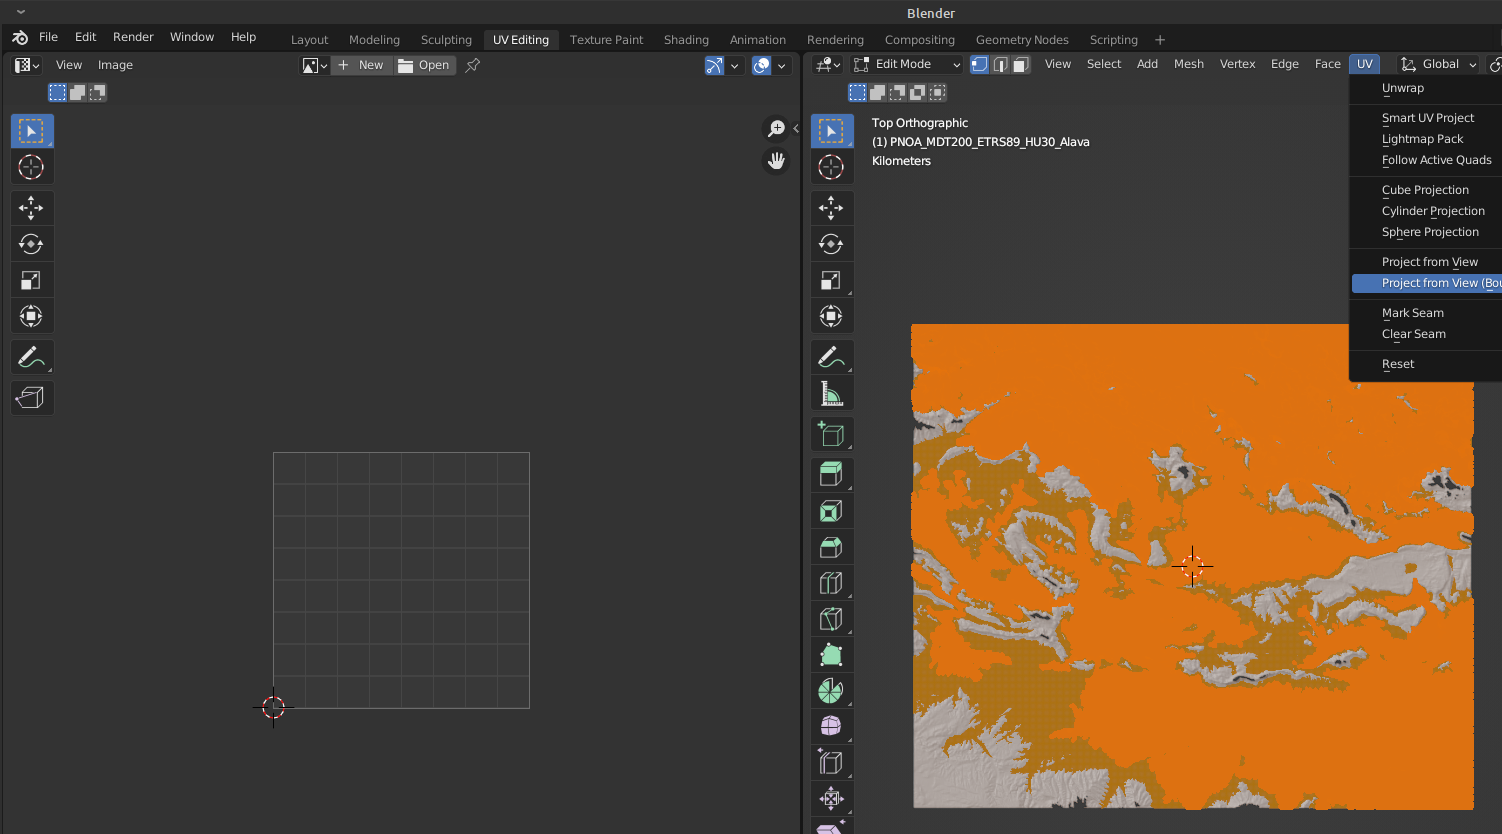
Now move to UV Editing tab.
Select the terrain layer on the right window, enter Edit Mode, and "Select all" faces (Ctrl+A). You should see it orange as below and make sure you are in "Top" view (press number 7).
Click on "UV" tools in the top menu and project the terrain layer with "Project from View (bounds)". This makes it fit the image extent.
On the left window, choose the image texture to apply to the projection and see how the grid adjusts to it (try making zoom on it)
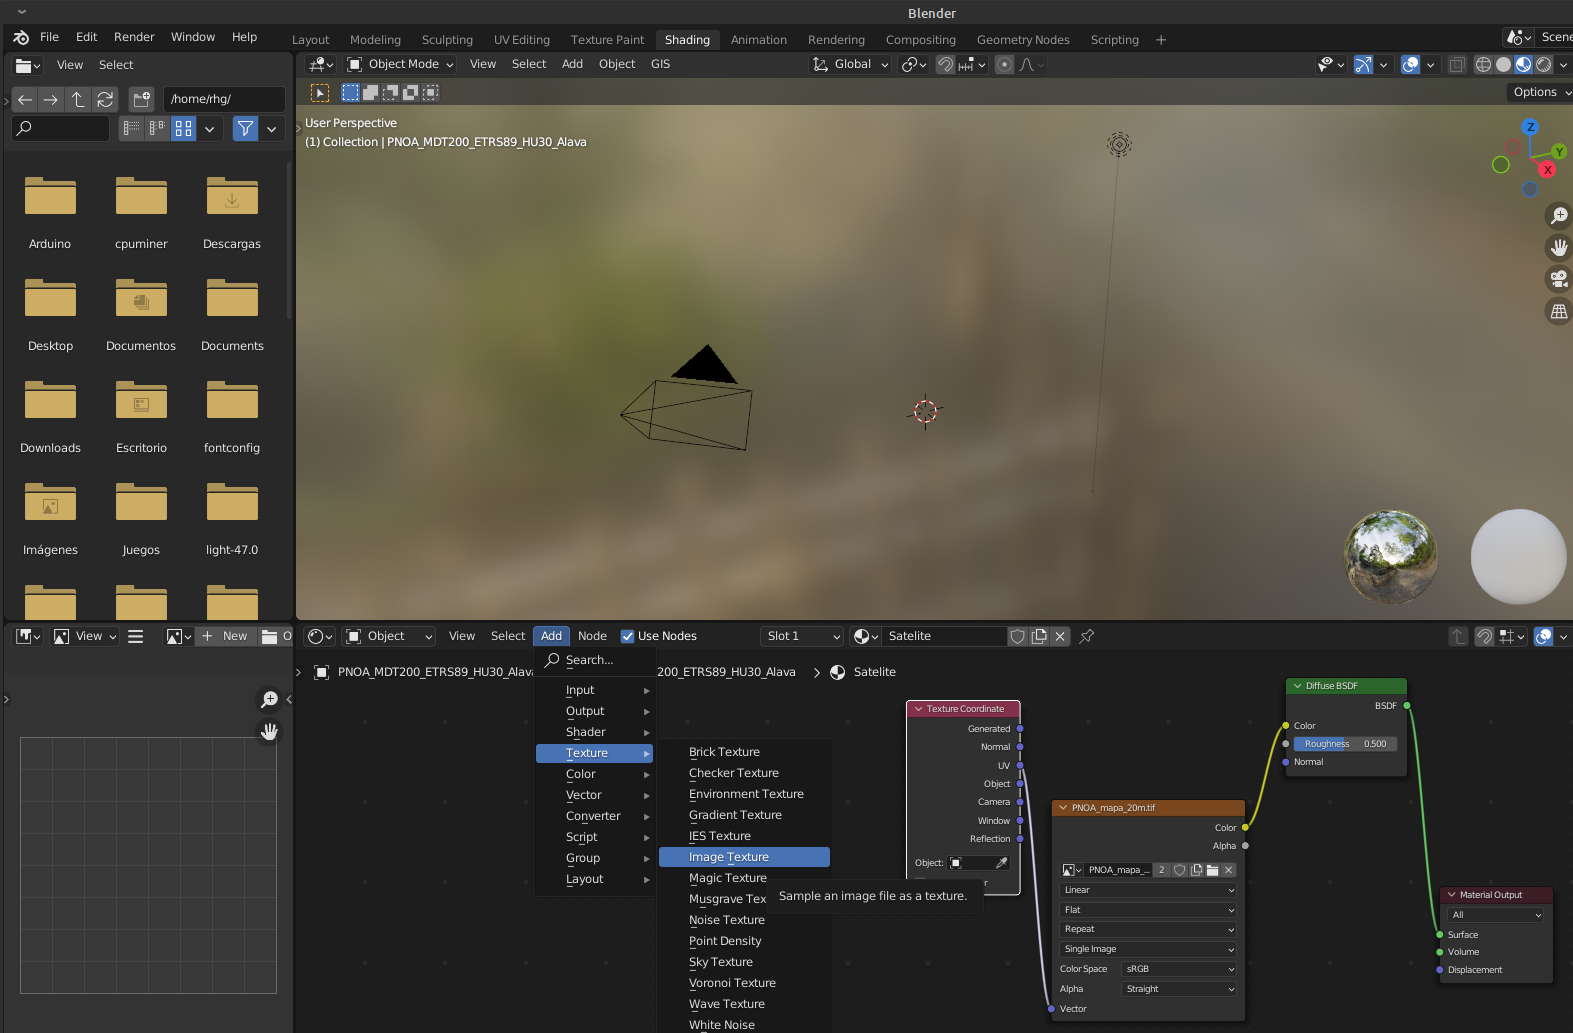
Finally, go to the Shading tab and add the element "Image Texture", choosing the right image and connecting Vector to UV and Color to Shader (just copy the image below).
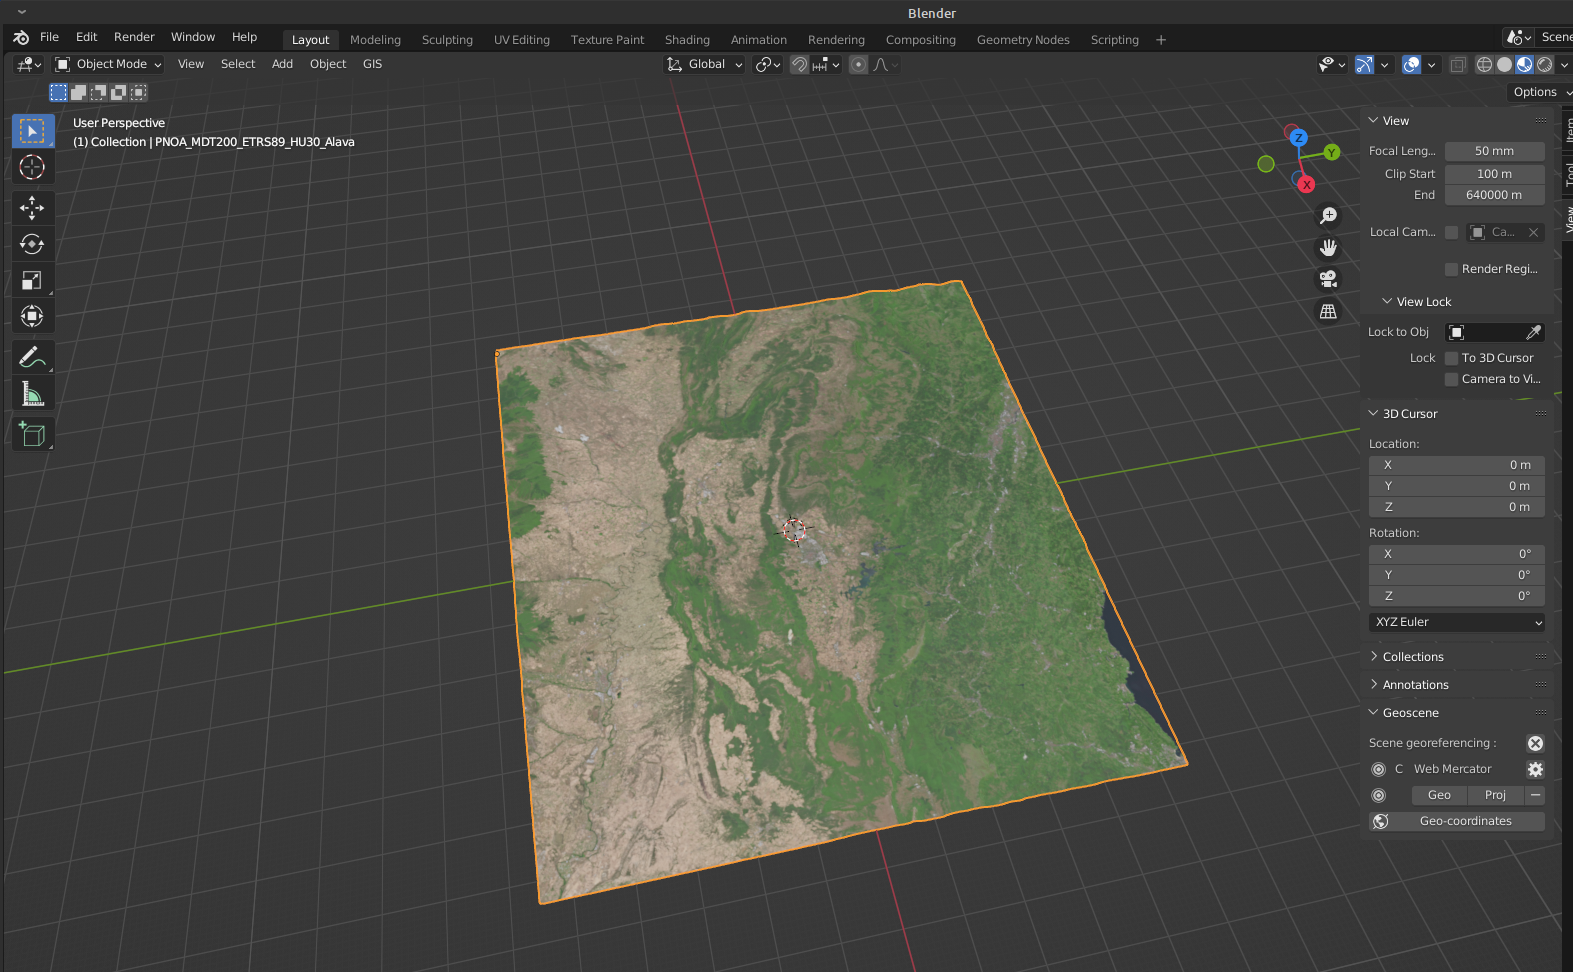
If you now go to the Layout window, the model will show the satellite image perfectly adjusted.
And it's ready so you can edit and export your model, for example, for 3D printing or for a realistic Unity3D scene.