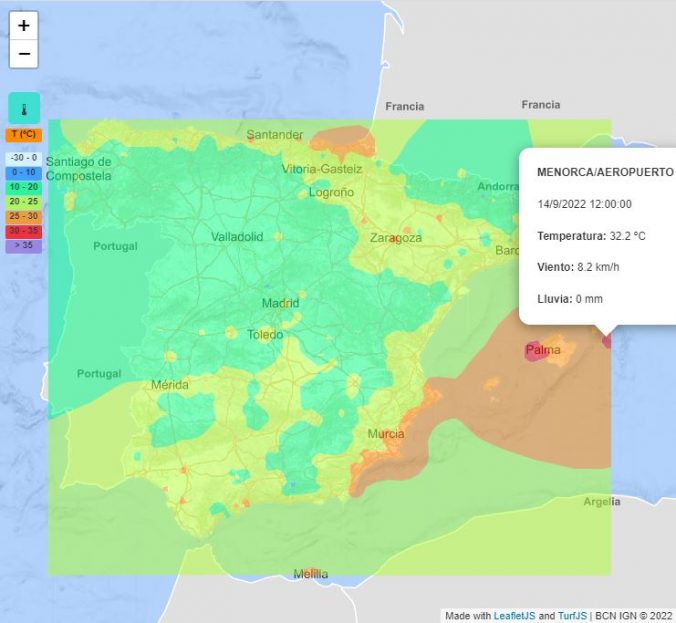
If you’ve used desktop GIS software, you will be surprised that many geospatial tools are also available to use in your web maps using a free and open-source javascript library.
Today I show you TurfJS. Press the button 🌤 in the map below and see one of many possibilities: inverse distance weighting or IDW.
Installation
TurfJS hosts a practical website explaining all available functions, as well as the initial setup:
https://turfjs.org/getting-started
To use Turf you only need to link the library in your map using the CDN link:
<script src='https://unpkg.com/@turf/turf@6/turf.min.js'></script>Base map
You can create a basemap, for example, with Leaflet. TurfJS uses JSON sintaxis, so it's highly compatible with the geoJSON capabilities in Leaflet.
TIP! Leaflet has been recently updated to version 1.9.1. This post hasn't been updated and still uses version 1.7.1.
I will recycle this example from one of my first posts with a few changes:
- Add the Turf library link in the
<head>. - Define the markers in a data matrix or array, similar to how they are obtained from any data source in JSON format:
https://www.w3schools.com/js/js_arrays.asp
var markers=[
{"name":"Estacion1",
"lat":25.77,
"lon":-80.13,
"dato":26.4},
{"name":"Estacion2",
"lat":25.795,
"lon":-80.21,
"dato":29.8},
{"name":"Estacion3",
"lat":25.70,
"lon":-80.275,
"dato":31.35}
];
TIP! Numeric values won't go in quotation marks, otherwise Turf will take it as a String (something that doesn't happen in Leaflet).
- Add the markers to the map in a loop, using
forEach(), widely used in these cases:
https://www.w3schools.com/jsref/jsref_foreach.asp
markers.forEach(function(m){
    var marker=L.marker([m.lat, m.lon]).addTo(map);
    marker.bindTooltip("<b>"+m.name+"</b><br>"+m.dato).openTooltip();
});

//WE ADDED A SINGLE MARKER LIKE THIS ON LEAFLET
//var marker = L.marker([25.77, -80.13]).addTo(map);
//marker.bindTooltip("<b>Estacion1</b><br>m.dato").openTooltip();
Looking like this:
and this one being its code:
<head>
<link rel="stylesheet" href="https://unpkg.com/[email protected]/dist/leaflet.css"
  integrity="sha512-xodZBNTC5n17Xt2atTPuE1HxjVMSvLVW9ocqUKLsCC5CXdbqCmblAshOMAS6/keqq/sMZMZ19scR4PsZChSR7A=="
  crossorigin=""/>
<script src="https://unpkg.com/[email protected]/dist/leaflet.js"
  integrity="sha512-XQoYMqMTK8LvdxXYG3nZ448hOEQiglfqkJs1NOQV44cWnUrBc8PkAOcXy20w0vlaXaVUearIOBhiXZ5V3ynxwA=="
  crossorigin=""></script>
<script src='https://unpkg.com/@turf/turf@6/turf.min.js'></script>
</head>

<style>
#map{border-radius: 30px;}
</style>

<body>
<div id="map" style="height:500px;"></div>
</body>

<script>
var map = L.map('map').setView([25.75, -80.2], 12);
L.tileLayer("http://a.tile.openstreetmap.org/{z}/{x}/{y}.png", {/*no properties*/
}).addTo(map);

var markers=[
{"name":"Estacion1",
"lat":25.77,
"lon":-80.13,
"dato":26.4},
{"name":"Estacion2",
"lat":25.795,
"lon":-80.21,
"dato":29.8},
{"name":"Estacion3",
"lat":25.70,
"lon":-80.275,
"dato":31.35}
];

markers.forEach(function(m){
    var marker=L.marker([m.lat, m.lon]).addTo(map);
    marker.bindTooltip("<b>"+m.name+"</b><br>"+m.dato).openTooltip();
});
</script>
IDW interpolation with TurfJS
In the form above, data is now easily used by TurfJS.
One of the most interesting tools is the interpolation of data in a regular grid.
https://turfjs.org/docs/#interpolate
This is done using a very usual method: inverse distance weighting (IDW).

Following the example given by TurfJS:
- Convert data into a Turf point layer, a featureCollection:
https://turfjs.org/docs/#featureCollection
//empty points array
var points=[];

//loop to fill the array with data
markers.forEach(function(m){
    points.push(turf.point([m.lon, m.lat],{name: m.name, dato: m.dato}));
});

//convert to Turf featureCollection
points=turf.featureCollection(points);
TIP! Note that Turf taked coordinates as longitude-latitude, instead of the usual latitude-longitude!
- Define interpolation options, having the following:
- gridType: or cell shape
- points
- square
- hex
- triangle
- property: field that contains the interpolation values.
- units: spatial units used in the interpolation:
- miles
- kilometers
- radians
- degrees
- weight: power used in the inverse distance weighting, usually 2, although higher values will make a smoother result.
- gridType: or cell shape
//interpolation options: rectangular grid using 'dato' variable in kilometers using the power of 2

var options = {gridType: 'square', property: 'dato', units: 'kilometers', weight: 2};- Finally, generate the interpolated grid and add it to the map, being the numeric value the cell size of the grid (0.5 Km):
//create Turf grid
var malla=turf.interpolate(points, 0.5, options);

//add to Leaflet
L.geoJSON(malla).addTo(map);
Generating this result (nothing conclusive):
Format grid and show values
Seems not, but the interpolation is done, it's just shown incorrectly.
I'll add a color ramp to represent data, and also show values when hovering the cells. Let's modify the Leaflet geoJSON object properties for this:
- style: function to modify object style, according to its value.
- onEachFeature: function added to each object to interact with it.
https://leafletjs.com/reference.html#geojson
https://leafletjs.com/examples/choropleth/
L.geoJSON(malla,{
  style:function(feature){
  var val=feature.properties.dato;
  if(val>30){
    return {fillColor: "orangered", fillOpacity: 0.5, weight:0};
  }else if(val>28 && val < 30){
    return {fillColor: "yellowgreen", fillOpacity: 0.5, weight:0};
  }else if(val>26 && val < 28){
    return {fillColor: "darkgreen", fillOpacity: 0.5, weight:0};
  }
},
onEachFeature:function(feature,layer){
  layer.on({
  mouseover:function(e){
    val=e.target.feature.properties.dato.toFixed(2);
    e.target.bindTooltip(val).openTooltip();
  }
  });
}
}).addTo(map);
Ending like this:
And here is the full code:
<head>
<link rel="stylesheet" href="https://unpkg.com/[email protected]/dist/leaflet.css"
  integrity="sha512-xodZBNTC5n17Xt2atTPuE1HxjVMSvLVW9ocqUKLsCC5CXdbqCmblAshOMAS6/keqq/sMZMZ19scR4PsZChSR7A=="
  crossorigin=""/>
<script src="https://unpkg.com/[email protected]/dist/leaflet.js"
  integrity="sha512-XQoYMqMTK8LvdxXYG3nZ448hOEQiglfqkJs1NOQV44cWnUrBc8PkAOcXy20w0vlaXaVUearIOBhiXZ5V3ynxwA=="
  crossorigin=""></script>
<script src='https://unpkg.com/@turf/turf@6/turf.min.js'></script>
</head>

<style>
#map{border-radius: 30px;}
</style>

<body>
<div id="map" style="height:500px;"></div>
</body>

<script>
var map = L.map('map').setView([25.75, -80.2], 12);
L.tileLayer("http://a.tile.openstreetmap.org/{z}/{x}/{y}.png", {/*no properties*/
}).addTo(map);

var markers=[
{"name":"Estacion1",
"lat":25.77,
"lon":-80.13,
"dato":26.4},
{"name":"Estacion2",
"lat":25.795,
"lon":-80.21,
"dato":29.8},
{"name":"Estacion3",
"lat":25.70,
"lon":-80.275,
"dato":31.35}
];

markers.forEach(function(m){
    var marker=L.marker([m.lat, m.lon]).addTo(map);
    marker.bindTooltip("<b>"+m.name+"</b><br>"+m.dato).openTooltip();
});

//empty points array
var points=[];

//loop to fill the array with data
markers.forEach(function(m){
    points.push(turf.point([m.lon, m.lat],{name: m.name, dato: m.dato}));
});

//convert to Turf featureCollection
points=turf.featureCollection(points);

//interpolation options: rectangular grid using 'dato' variable in kilometers using the power of 2

var options = {gridType: 'square', property: 'dato', units: 'kilometers', weight: 2};

//create Turf grid
var malla=turf.interpolate(points, 0.5, options);

malla=L.geoJSON(malla,{
  style:function(feature){
  var val=feature.properties.dato;
  if(val>30){
    return {fillColor: "orangered", fillOpacity: 0.5, weight:0};
  }else if(val>28 && val < 30){
    return {fillColor: "yellowgreen", fillOpacity: 0.5, weight:0};
  }else if(val>26 && val < 28){
    return {fillColor: "darkgreen", fillOpacity: 0.5, weight:0};
  }
},
onEachFeature:function(feature,layer){
  layer.on({
  mouseover:function(e){
    val=e.target.feature.properties.dato.toFixed(2);
    e.target.bindTooltip(val).openTooltip();
  }
  });
}
}).addTo(map);

</script>
Applications
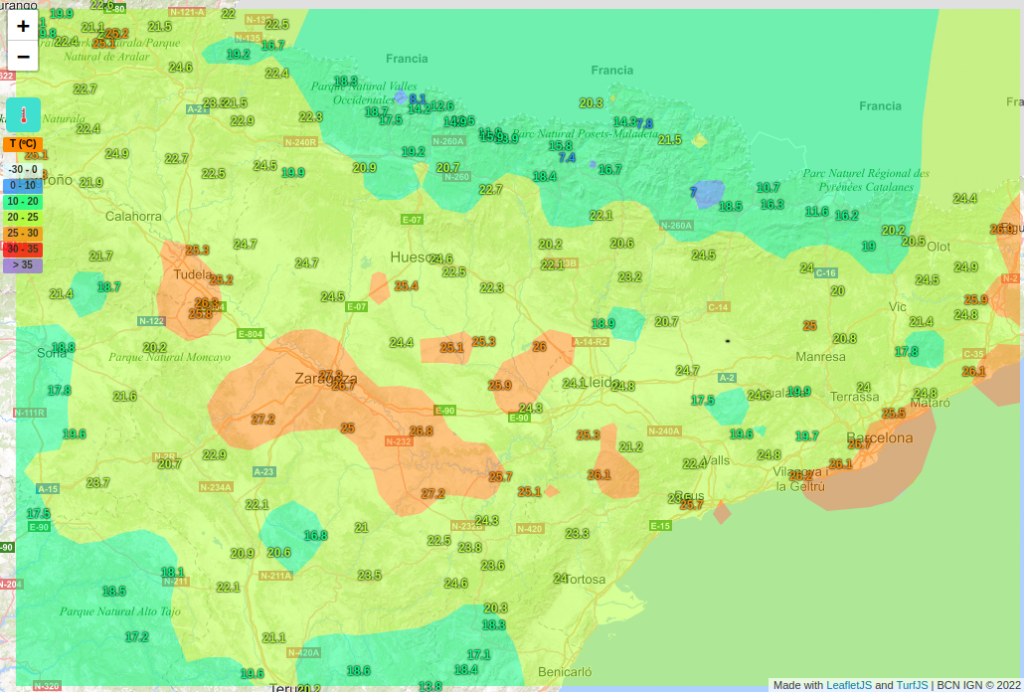
Applying this to real data, I modified the leafMET library to add the interpolation using isobands.
It's the map you saw at the beginning which you can see fullscreen:
https://theroamingworkshop.cloud/leafMET/leafMET+Turf.html
The code is also available as a new branch of leafMET in github:
https://github.com/TheRoam/leafMET/tree/leafMET+Turf
And that's all! Hope you find it useful!
Any doubts or comments are awaited on 🐦 Twitter!


