In this post I explained how to directly add AEMET stations with certain data, using my leafMET plugin for Leaflet (available on github):
https://github.com/TheRoam/leafMET
Let’s now pay attention to the detail of the API and how to access all the available data.
API access
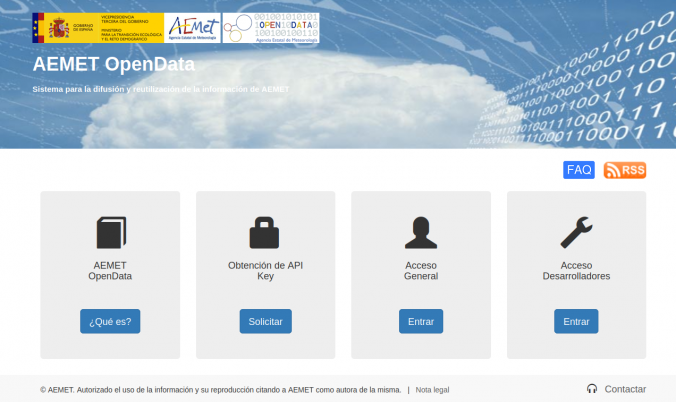
To use the API we need an API key. Go to the AEMET OpenData webpage and click on "Solicitar" to request it.
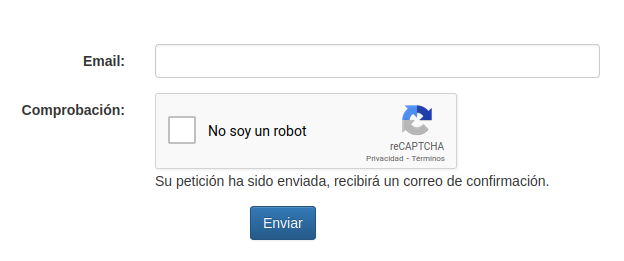
Next we'll be asked for an email address where the key will be sent.
You'll receive a first confirmation email, and then a second email with the access key. Let's copy it and keep moving.
Documentation and examples
Get back to AEMET OpenData and into the developer's section "Acceso Desarrolladores".
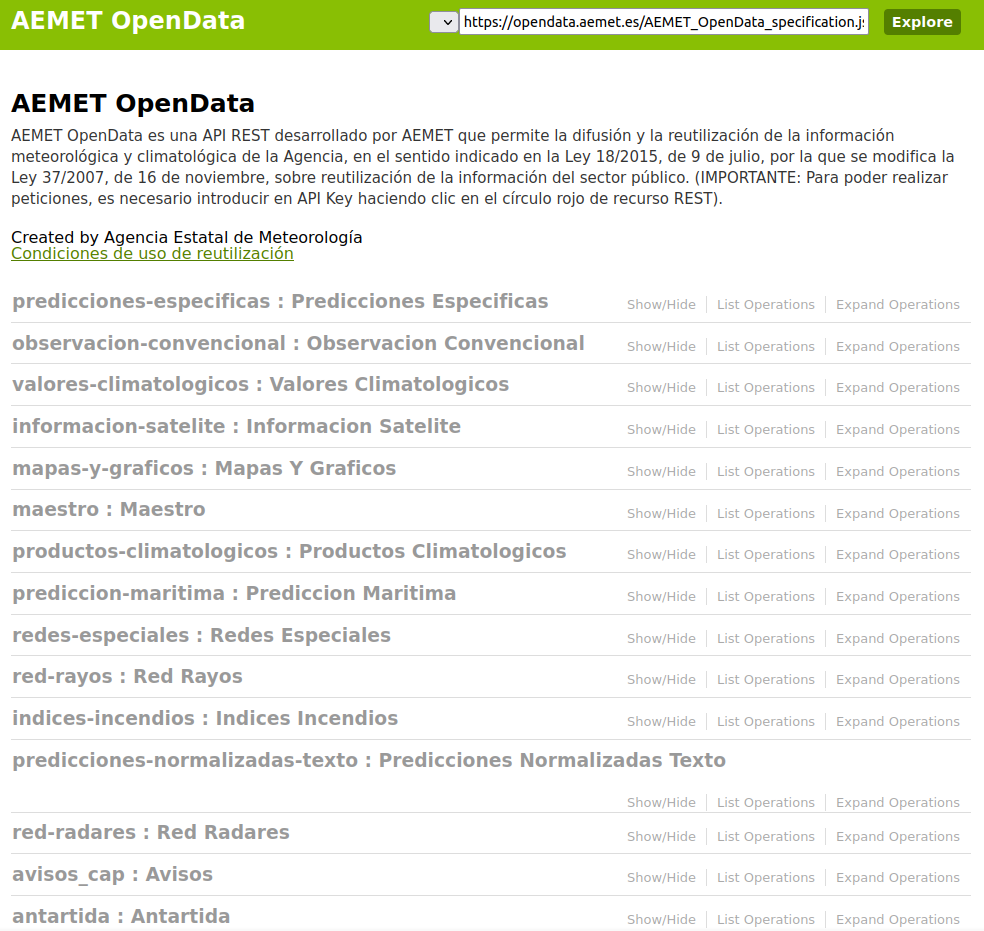
We're interested in the dynamic documentation, which shows all the data requests available that we can try live.
Click on each topic to display the syntax for every data request.
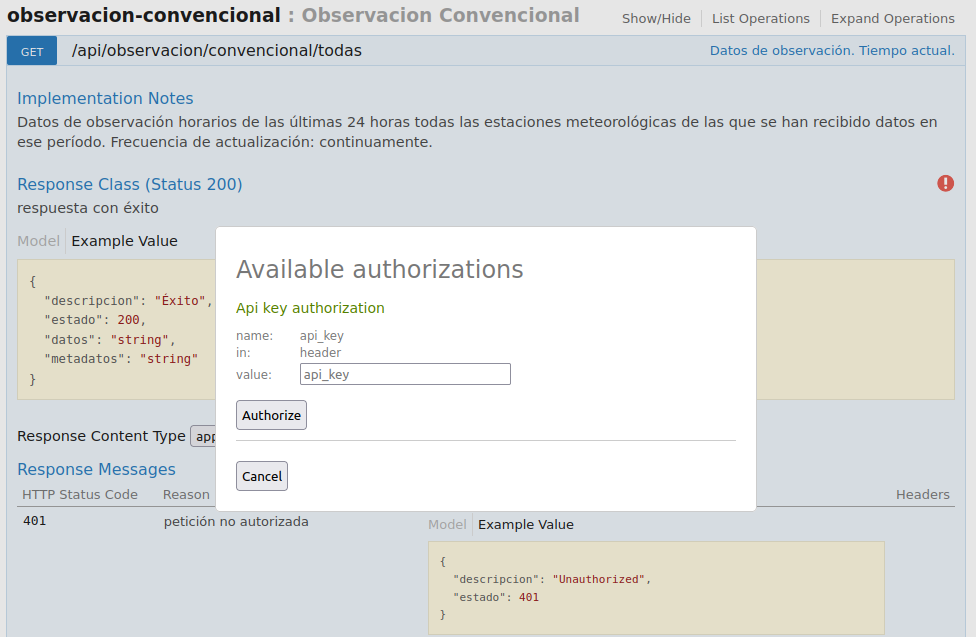
Click on observación-convencional and then /api/observacion/convencional/todas.
Now click on the red sign on the right, where you'll paste and authorize the API key.
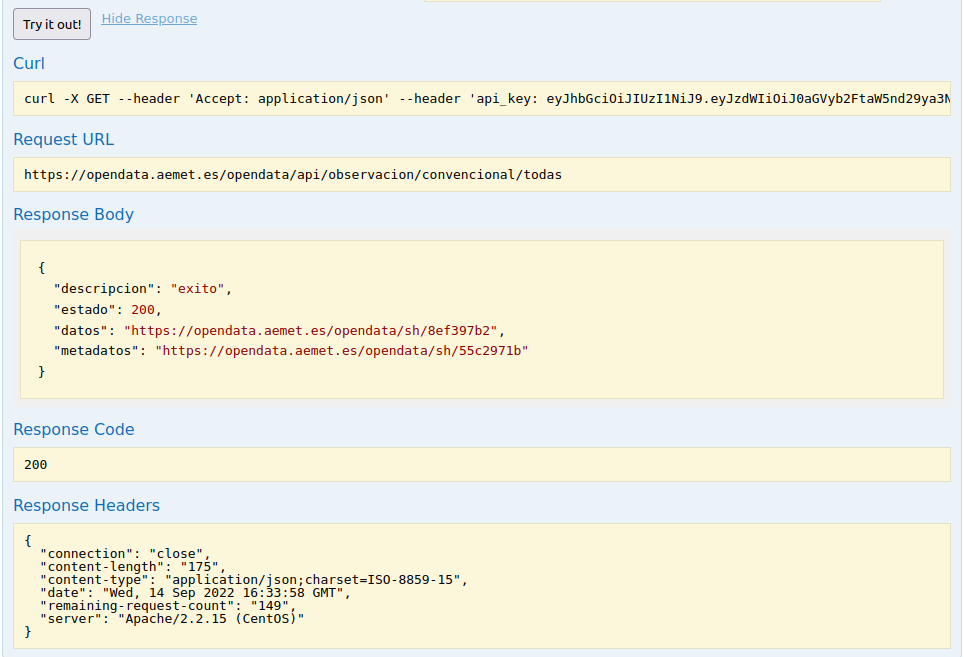
Now press the Try it out! button and you'll get:
- a curl request example
- the request URL
- the body, code and headers of the response
If we open the URL inside the "datos" field we'll see the full list of data for all the stations. A JSON lot like this:
Loading...
The main fields are the following:
- idema: station ID or code.
- lat and lon: latitude and longitude coordinates.
- alt: station altitude.
- fint: data interval date.
- prec: precipitation in this period.
- vv: wind speed in the station.
- ta: ambience temperature in the station.
Data request using javascript
HTML structure
I'll develop an example to access the data and make use of them.
I'll simply create a .html document with a request button, a text line and a request function:
Click the button to request data
<html>
<body>
<button id="solicitud" onclick="solicitar()">Request</button>
<p id="texto">Click the button to request data</p>
</body>
<script>
function solicitar(){
document.getElementById("texto").innerHTML="I didn't program that yet..";
}
</script>
</html>
TIP! Copy and paste the code above in a text document with .html extension and open it in your browser.
HTTP request
We'll do the data request in javascript using the XMLHttpRequest object. The example from w3schools is really simple:
https://www.w3schools.com/js/js_ajax_http.asp
As we saw in the dynamic documentation, after doing the request, we got a link to the data, which is another request, no we need to nest two requests like this:
<script>
function solicitar(){
// Define loading message
document.getElementById("texto").innerHTML="Cargando datos...";
// Define API Key
var AK=tUApiKey;
// Define request URLs
var URL1="https://opendata.aemet.es/opendata/api/observacion/convencional/todas";
var URL2="";

// Create XMLHttpRequest objects
const xhttp1 = new XMLHttpRequest();
const xhttp2 = new XMLHttpRequest();

// Define response function for the first request:
// We want to access te "datos" URL
xhttp1.onload = function() {
  // 1º Parse the response to JSON:
  URL2=JSON.parse(this.responseText);
  // 2º Get the "datos" field:
  URL2=URL2.datos;
  // 3º Make the new request:
  xhttp2.open("GET", URL2);
  xhttp2.send();
}

// Define response function for the second request:
// We'll modify the text line with some information in the data
xhttp2.onload = function() {
  // 1º Parse the response to JSON (much better to work with):
  var datos=JSON.parse(this.responseText);

  // 2º Get the length of the JSON data
  // This is equivalent to the individual hourly entries per stations
  var registros=datos.length;

  // 3º Get first entry date.
  // We'll format it as it's in ISO standard
  var fechaini=datos[0].fint;
  fechaini=new Date(fechaini+"Z");
  fechaini=fechaini.toLocaleDateString()+" "+fechaini.toLocaleTimeString();

  // 4º Get last entry date.
  // We'll format in the same way
  var fechafin=datos[(datos.length-1)].fint;
  fechafin=new Date(fechaini+"Z");
  fechafin=fechafin.toLocaleDateString()+" "+fechafin.toLocaleTimeString();

  // 5º Merge it all and display in the text line
  document.getElementById("texto").innerHTML="Se han descargado <b>"+registros+"</b> registros desde el <b>"+fechaini+"</b> hasta el <b>"+fechafin+"</b>. <a href='"+URL2+"' target='_blank'>Ver todos los datos.</a>";
}

// Send the first request
xhttp1.open("GET", URL1+"/?api_key="+AK);
xhttp1.send();

}
</script>
Let's see the result below:
Click the button to request data
And done! This way you can obtain coordinates and values for different metheorological stations from AEMET and drop them in a table or web map like we've seen for Leaflet here.
Leave any comments or queries on Twitter!🐦
